Curated OER
Hypothermia: Temperature Changes Under Varying Conditions
Students conduct an experiment to determine what type of clothing would be most suitable for outdoor activities. They determine the temperature changes of the skin under various wet clothing materials and graph the temperature changes. ...
Curated OER
Monitoring Estuarine Water Quality
Learners analyze water quality data from real data. In this environmental science lesson, students examine how salinity and dissolved oxygen affect the living organisms in the estuary. They interpret graphs to support or disprove a...
NOAA
Climographs
In the second lesson plan of a five-part series, young climatologists use provided temperature and precipitation data to create climographs of three different cities. They then analyze these climographs to develop a general understanding...
NOAA
A Matter of Density
Larvae transportation on the New England seamounts is based on the density of the water. Scholars calculate density and graph salinity versus temperature to better understand the distribution of organisms in a water column. Discussions...
NOAA
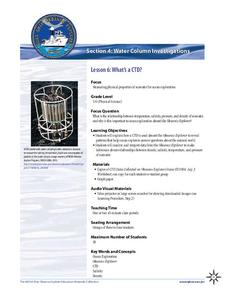
What's a CTD?
Why are the properties of the water important when exploring the ocean? Young scientists discover the tools and technology used in deep sea exploration in the fourth installment in a five-part series. Groups work together to examine...
Chicago Botanic Garden
Historical Climate Cycles
Scientists use ice core samples to obtain temperatures of the earth from 400,000 years ago! The third of five lessons instructs pupils to interpret historical climate data to see changes over time. In part I, participants interpret...
NOAA
The Oceanographic Yo-yo
How does chemistry help deep-sea explorers? Part four of a five-part series of lessons from aboard the Okeanos Explorer introduces middle school scientists to technologies used in ocean exploration. Groups work together to analyze data...
Curated OER
The Effect of Rain on Morning Temperatures
Eighth graders study the effects of the water cycle. They create a graph of the air temperature versus solar radiation on a rainy and clear 24 hour period using data from a provided link. Afterward, they answer questions to determine the...
Curated OER
Using A Volunteer Acquired Database Constructed On The Internet, Examine the Relationship between Dissolved Oxygen and Water Temperature
Ninth graders access a database and open a spreadsheet. In this oxygen and water temperature lesson students save the database, sort it and generate scatter plot graphs.
Curated OER
Animal Science - Body Temperature
Young scholars use the TI-83 + linked to the CBL2 and temperature probes to perform an experiment. Each of the temperature probes is placed into a different cup, one insulated and one not insulated. Each cup holds warm water. The two...
Curated OER
Temperature School
Students observ the cooling and warming of room temperature, hot, and ice cold cans of water by measuring the change in temperature over time. They then attempt to develop explanations for the observations made and apply their findings...
Curated OER
Water Quality in the Greenhills Stream
Seventh graders conduct year long study of water quality over different seasons using variety of probes, including D.O., pH, conductivity and temperature, that are attached to portable technology. Students select three data points in...
Curated OER
Temperature
Students explore the concept of temperature. In this temperature lesson, students read thermometers in degrees Celsius. Students discuss the temperature of the seasons and what clothing they might wear given a certain temperature....
Curated OER
Temperature
Young scholars explore hot, warm, and cold. In this temperature instructional activity, students use thermometers to find specific temperatures. Young scholars also consider how colored items absorb heat as they participate in a...
Curated OER
Heat Energy- Temperature
Second graders investigate the meaning of temperature. They determine what happens to a thermometer when the temperature rises or falls. They place thermometers in different classroom locations in order to compare the temperature in a...
Curated OER
Testing the Waters
Eleventh graders examine a local body of water. For this science lesson, 11th graders collect water samples to test. Students analyze the data and make conclusions. Students create tables and graphs of the data.
Curated OER
Water Usage and Conservation
Middle schoolers investigate water usage at school and at home. They use graphs and tables to evaluate water usage. Students describe possible water conservation measures. They use graphs and tables to relate data as part of a written...
Curated OER
WATER CHEMISTRY
Students list reasons why water is important and investigate and graph the freezing points of different solutions.
Alabama Learning Exchange
Is My Water Safe?
Learners discuss what makes their drinking water safe and unsafe. They locate and visit a local tributary and test the water's pH, hardness, dissolved oxygen, and total alkalinity. They compose a summary paragraph about the tests and...
Curated OER
Temperature in the Sun or Shade of the Desert
Third graders use thermometers to measure the air temperature in several
places around the school and then return to the classroom to record the data. They create a bar graph and discuss their findings about the air temperature in the...
Curated OER
Energy Worksheet #1
A graph of Earth's average monthly temperatures from 1990 to 1994 is posted across the top of the page for meteorology masters to analyze. Five multiple choice questions are asked regarding temperature variation. This does not have to be...
Curated OER
Ice Cream Lab
I scream, you scream, we all scream for ice cream! Even high schoolers enjoy making ice cream. This laboratory exercise has them record the temperature changes throughout the process of liquid becoming solid, graph the results, and...
Curated OER
Rainbows, Bridges & Weather, Oh My!
Explore how real-world applications can be parabolic in nature and how to find quadratic functions that best fit data. A number of different examples of modeling parabolas are explored including a student scavenger hunt, the exploration...
Curated OER
Invasives and Marsh Birds
Students are taught that invasive plant removal can have a variety of impacts. They are shown this by using graphs. Students view maps of vegetation change on Iona Island. They discuss implications of changes on marsh birds using data...


