Curated OER
Reading Bar Charts
Help kids understand how to collect data through surveys, organize data in a bar chart, then analyze their findings. There are three different surveys for learners to conduct, a full description of all the parts of a bar chart, and three...
K-5 Math Teaching Resources
Blank Bar Graph Template
This template is just begging for your young mathematicians to fill it in with colorful bar graphs! With horizontal and vertical axes in place and grid lines for added support, this is a great resource for teaching children how...
Curated OER
Graphing the Forecast - Line Graph or Bar Graph?
Sixth graders compare and contrast bar and line graphs. Using a weather forecast of the area, 6th graders record the high and low temperatures in a table. Students determine and justify the most appropriate graph to display a given set...
Curated OER
Data Collection
Students write a journal exercise that relates to pets. They collect information from each other in order to practice making and interpreting bar graphs. They Continue building different kinds of graphs with the group.
Curated OER
Graphing the Forecast-Line Graph or Bar Graph?
Students explore bar and line graphs. In this data collection, graphing, and weather activity, students compare bar and line graphs and discuss which type of graph would be most appropriate for displaying a ten day weather forecast....
Curated OER
Math: Graphs and Their Symbols
Second graders examine different types of graphs and discover the meanings of the symbols used on them. After gathering data about themselves, their communities, and the world, they use that information to create graphs. Among the...
Curated OER
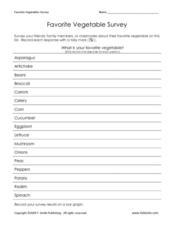
Favorite Vegetable Survey
What's your favorite? Use this chart template in your lesson on data collection and graphing. Learners record classmates' favorite vegetable in a survey, and then graph the results. A labelled graph is provided here- print both pages...
Curated OER
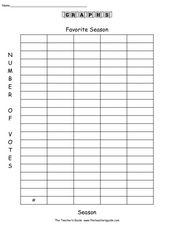
Favorite Season
In this graphing worksheet, learners conduct a survey of people's favorite survey. They then complete 8 questions about the data gathered before creating a bar graph and pictograph on templates.
Pennsylvania Department of Education
Up on Top
Students make bar graphs and identify items in the bar graphs as being likely, certain, or impossible. In this bar graphs lesson plan, students answer questions about the bar graphs using reasoning and communication skills.
Curated OER
Run, Gingerbread Men, Run!—Game
Run, gingerbread men! During the board game, four gingerbread men race to discover which one finishes first. Scholars take note of the game's results using a tally chart and bar graph for all to observe the frequency of the winning...
Curated OER
Graphs: Favorite Pet Graph
In this graphing learning exercise, students use the data from a tally chart to create a bar graph. The graph template is provided, and students fill in the bars.
Curated OER
A Reading Graph
Students construct and interpret a "favorite classroom books" graph. In this literacy and math graphing lesson, students choose a reduced size copy of the book cover that corresponds with the book(s) they chose to read during their...
Curated OER
Making Graphs
Students explore statistics by conducting class demographic surveys. In this graph making lesson, students identify the family members of each classmate, pets they own, and favorite activities. Students organize their statistics and...
Oklahoma State University
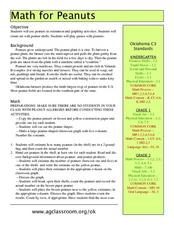
Math for Peanuts
Peanuts! Get your peanuts! Kids explore math, art, and agriculture concepts focused on peanuts. There is a brief informational text to get them started, and you'll find definitions of five in-text vocabulary words to address. Kids...
Curated OER
Jellybean Graphs
Second graders predict and graph data based on the color of jelly beans they think are in a handful. In this prediction lesson plan, 2nd graders will predict how many of each color jellybean are in a handful. Then they graph these...
Haiku Deck
Haiku Deck - Beautiful Presentations and Slideshows with Charts and Graphs
Create beautiful and simple presentations, sales pitches, lessons, and visual stories that utilize Getty Images, high quality photos licensed under Creative Commons, as well as your own prints. What you create will demand people’s...
Curated OER
Where Do I Fit on the Graph?
Young scholars collect data and create graphs about themselves, their community, and the world around them. They use a variety of methods to organize data, such as stickers, clothespins, name tags, coloring, tally marks, etc.
Curated OER
Gingerbread Man Math
Students collect and explore gingerbread man data. In this math and technology lesson plan, students examine how to organize and interpret data in three formats: objects, pictures, and graphs.
Curated OER
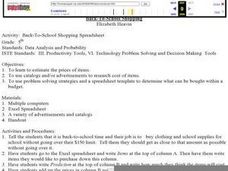
Back-To-School Shopping
Fifth graders estimate the prices of items to be bought for back to school. They use catalogs and/or advertisements to research the cost of each of the items. They use problem solving strategies and a spreadsheet template to determine...
Curated OER
A Birthday Basket for Tia
Students practice reading and math skills using technology. In this main idea instructional activity, students retell the important events of A Birthday for Tia in sequence using Kid Pix. Students create a bar graph...
Curated OER
Shirts Full of Buttons
Students match sets of buttons to complete subtraction problems. In this subtraction lesson plan, students answer the questions "how many more/less" and make bar graphs by counting up the buttons they are wearing.
Curated OER
Environmental Risk Analysis
Students complete a survey and enter the responses in a spreadsheet. The spread sheet is used to create a bar graph. Students complete spreadsheets listing types of hazards in their community.
Curated OER
Bus Graph
Students make predictions about which bus takes the most/least students in the classroom. They use KidPix bus stamp for each student who goes home on that bus number and record data and discuss predictions.
Curated OER
Understanding Presidential History
Students research to find the qualifications necessary to be President of the U.S. In this presidential qualification lesson, students research their family roots to see if they could qualify to be President. Students create a graph to...


