Education World
High, Low, or In Between?
Trios play a card game that reinforces the concepts of number sequence and greater than and less than. Scholars make predictions based on information they know and a single unknown. They see cards drawn by others in the group, but not...
Curated OER
Modeling Linear Relationships
Students graph lines using the slope and y-intercept. In this algebra lesson, students create data using tables and equations. They use their data to make predictions and draw conclusion.
Curated OER
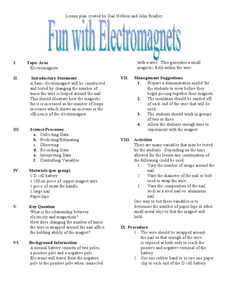
Fun with Electromagnets
Junior scientists work in groups to construct electromagnets. They experiment by varying number of wraps around the nail, the diameter of the nail, and the type of metal the nail is made of to see if any of these factors has an...
Curated OER
Excel Lesson Plan Coin Statistics
Second graders determine the difference between making a prediction and determining actual information. They design a spreadsheet for a coin flipping activity on which they include their predictions and what actual happens when they flip...
Courseware Solutions
Understanding Algebraic Expressions
Prealgebra apprentices read seven phrases and write an expression for each. The printable version of the worksheet is not very attractive; it has the standards information printed at the top. The problems are arranged in a table and are...
Curated OER
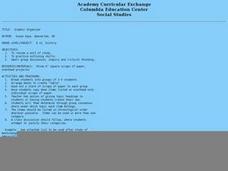
Graphic Organizing: Early American History
In collaborative groups, young US historians sort cards (each labeled with a single early American event or issue) according to which of the first four presidents was leading the country at the time. Learners copy the events onto a...
Curated OER
What's in a Shape?
Students explore characteristics of shapes by making and using tangram sets. They discover how the tangram pieces are related to one another, and determine how many different combinations of the triangles, squares, and parallelograms in...
Curated OER
Native American Unit: Using One Computer to Record Data
Students explore methods to manage a classroom with one computer. Prospective teachers observe a video of students collecting information on Native American tribes. They discuss the use of white boards and electronically recording...
Curated OER
Time, Tide, and Quahogs
Students read tide tables for Waquoit Bay as the simulate determining the best time to go clam digging for a Wampanoag clambake. They graph the tide tables while realizing that the tides a Waquoit Bay are one hour later than those at...
Curated OER
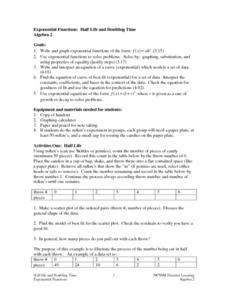
Exponential Functions: Half Life and Doubling Time
High schoolers investigate the concept of exponential functions and how they increase in size over time. They simplify the functions in order to find the solutions that are possible and perform analysis of the curved line that is...
Curated OER
Jo's Table
Students continue a sequential pattern using a partially filled in table and simple addition exercise. They use problem solving strategies such as guess and check, make a table, look for patterns. They discuss their finding with the class.
Curated OER
Random Number Generators And Probability, Will the Wings Win??
Students participate in probability experiments and simulations while modeling and solving problems. They examine how to use the random number generator on a graphing calculator using examples from their local hockey teams.
Curated OER
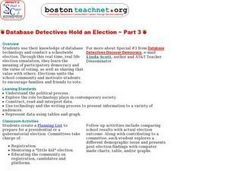
Database Detectives Hold an Election ~ Part 3
Pupils use a database to conduct a schoolwide election. They discover the importance of voting and democracy. They incourage one another to vote.
Curated OER
The Time I Got Lost
Third graders go through the writing process but substitute paper and pencil with the computer to create a story about "The Time I Got Lost".
Curated OER
A Tale of Two Reactors
Tenth graders role-play as members of the food chain. Sticky tables acting as polluting factors are introduced and members of different trophic levels suffer varying degrees of damage due to those pollutants.
Curated OER
Speed and Experiments
In this speed formula and scientific method worksheet, high schoolers read over descriptions of the formula an method. Students then respond to 12 matching, problem solving and short answer questions.
Curated OER
A Keen Sense of Smell
Students investigate their sense of smell by experimenting with smelly objects. In this human senses instructional activity, students examine the length of time it takes to smell a random object that is close to them....
Curated OER
Data Handling: Bus Charts
In this data display and analysis worksheet, students study a bar graph that shows the number of people who ride the bus at different times of day. Students use the graph to solve 6 problems. Note: Bus times are shown in 24 hour clock time.
Curated OER
Table Placemats
For this desktop place mat worksheet, students refer to personalized resource sheets. The sheets include months, 3D shapes, 2D shapes, numbers, the alphabet, days of the week, and sight words.
Curated OER
100 Stamps for 100 Days
Second graders count by 2's to get to 100. In this counting lesson plan, 2nd graders use the program Kid Pix to create stamps two at a time until they get to 100.
Curated OER
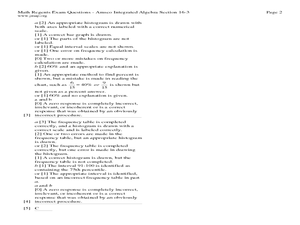
The Histogram
In this Algebra I/Algebra II worksheet, students construct and analyze histograms to develop a visual impression of the distributions of data. The two page worksheet contains five problems. Answer key is provided.
Curated OER
Estimate Products
In this estimating products worksheet, students interpret data on the yearly diets of the average American, then solve 6 word problems where they must estimate products by rounding the larger factor to its greatest place value.
Curated OER
Name That Tune: Matching Musical Tones Through Waveform Analysis
Pupils detect the waveform of musical notes to determine the code for the "safe" in this forensics simulation lesson. They use a microphone and tuning forks along with Vernier EasyData on their graphing calculator to analyze five musical...
Inside Mathematics
Swimming Pool
Swimming is more fun with quantities. The short assessment task encompasses finding the volume of a trapezoidal prism using an understanding of quantities. Individuals make a connection to the rate of which the pool is filled with a...


