EngageNY
Modeling a Context from Data (part 2)
Forgive me, I regress. Building upon previous modeling activities, the class examines models using the regression function on a graphing calculator. They use the modeling process to interpret the context and to make predictions based...
NASA
Next Generation Spacecraft—Orion
What is the cross-sectional area of the Orion spacecraft? Groups work together to estimate the area of a cross section of the Orion spacecraft by first counting the number of grids a scale drawing covers. Pupils also employ a method...
Curated OER
Confidence Levels
Students collect data and graph it. In this statistics lesson, students rate confidence levels by collecting data and analyzing it. They graph their findings on the Ti calculator.
Curated OER
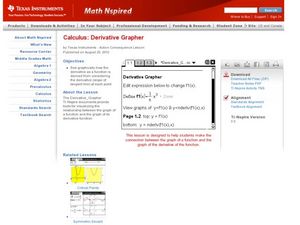
Derivative Grapher
Learners graph the derivative of functions in this calculus lesson plan. They use the TI to graph their functions and algebraically take the derivative of each function. They then create a visual and analyze the graph.
Eisenhower Regioanl Consortium for Mathematics and Science Education
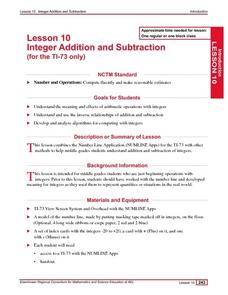
Lesson 10: Integer Addition and Subtraction (for the TI-73 only)
Using a number line on the floor made from masking tape and manipulatives, learners observe a demonstration of the addition and subtraction processes. After completing several worksheets, they solve three-term problems using calculators...
Curated OER
TI-82 PROFICIENCY
Young scholars find the proper factors for numbers one through fifty using either the divisibility laws or TI-82. They determine the sum of the proper factors for each number. If the sum of the factors is less than the number itself,...
Texas Instraments
Getting Started Dilemma
Get out those thinking caps and apply graphing functions to a real-world problem. Use the TI-83 graphing calculator to evaluate algebraic expressions that are imbedded in a series of real-world scenarios. A great lesson!
Statistics Education Web
It Creeps. It Crawls. Watch Out For The Blob!
How do you find the area of an irregular shape? Class members calculate the area of an irregular shape by finding the area of a random sampling of the shape. Individuals then utilize a confidence interval to improve accuracy and use a...
NASA
Weightless Wonder
A video of the weightless wonder provides a setting for the math to follow. Groups analyze the graph of a quadratic function that models the path of the C-9 as it gives astronauts the experience of weightlessness. Using a graphing...
Texas Instruments
Math TODAY for TI-Navigator System - Is Leisure Time Really Shrinking?
High schoolers organize data from the USA TODAY Snapshot, "Is leisure time really shrinking?" into two scatter plots and determine the quadratic model for each scatter plot. They determine if these graphs intersect and learn the concept...
Curated OER
Math TODAY for TI-Navigator System - Humidity Makes Air Feel Even Hotter ? Part II
Learners explore quadratic and cubic functions that will model the relationship between air temperature and heat index at fixed relative humidity values. They also make generalizations and apply the findings using their TI-83 Plus or...
Texas Instruments
Graphing Calculator Investigation Graphs of Relations
Learners investigate relations in this algebra lesson. They graph the set of ordered pairs that determine a relation. Using a TI-83 Plus, your learners will enter the coordinates in a list, create a scatter plot, and manipulate the...
Curated OER
Advanced Algebra with the TI-89
Pupils investigate the formulas for volumes of various solids using the Ti-89 calculator. The lesson focuses on the keying sequences necessary to embed the required volume formula in a program which is then used in the problem solving...
Curated OER
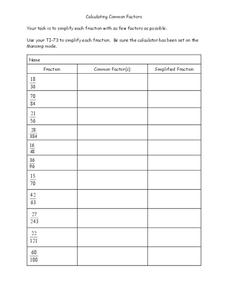
Calculating Common Factors
In this calculating common factors learning exercise, students solve 11 short answer problems. Students simplify fractions in as few steps as possible by finding common factors.
Curated OER
Graphing Linear Equations on the TI
Students graph linear equations on the TI calculator. In this algebra lesson, students rewrite equations in the slope intercept form and use the calculator to graph their problem. They work together to interpret the graphs off of the TI.
Curated OER
Graphing Linear Equations with Calculator
Students graph lines using the calculator. In this algebra lesson, students graph lines of equations in the form y=mx+b. They input equations into the TI Calculator and graph using the slope and intercept. They analyze the graph for...
Curated OER
The "U's" Have IT!
Young scholars explore the maximum and minimum values of parabola. In this exponential equations lesson, students use graphing calculators or TI Interactive Software to calculate values of parabola and graph x-intercepts of parabola.
Curated OER
The Coordinate Plane
Use this Saxon math coordinate plane worksheet to have your learners utilize a graphing calculator, equate the vertices of a rectangle, and then graph their conclusions as well as answer a variety of fill in the blank equations.
Curated OER
Number Line: Negative Numbers
In this graphing calculator worksheet for the TI-83 calculator, students first observe a demonstration for calculating negative numbers. Next, students use their graphing calculator to answer 6 thoughtful T/F and short answer...
Curated OER
Box Plots on the TI-83 Calculator
Eighth graders research box plots on the Internet. They gather real life statistics and analyze the collected statistics by making multiple box plots on the TI-83 calculator.
Curated OER
Linear Regression on TI-89
In this linear regression worksheet, learners use the TI-89 calculator to graph linear regressions. Details instructions on the use of the calculator are provided. This one-page worksheet contains six problems.
Curated OER
Linear Regression on TI-86
In this linear regression worksheet, students solve linear regression problems using the TI-86 calculator. Detailed instructions on how to use the calculator are provided. This one-page worksheet contains seven problems.
Curated OER
Linear Regression on TI-85
In this linear regression worksheet, students use TI-85 calculators to complete linear regression expressions. Detailed instructions on the use of the calculator are provided. This one-page worksheet contains seven problems.
Curated OER
Recursion on a Calculator
In this math worksheet, students investigate repeated values on the calculator. They also read the explanation of the golden triangle and its proof.


