EngageNY
Tides, Sound Waves, and Stock Markets
Help pupils see the world through the eyes of a mathematician. As they examine tide patterns, sound waves, and stock market patterns using trigonometric functions, learners create scatter plots and write best-fit functions.
Curated OER
High and Low Tides
Students collect real world data from the Web regarding high and low tides at various locations in the United States. They find a function which models this data and make predictions on tide levels based on the information found.
Illustrative Mathematics
Tides
A very simple example of a functional relationship between depth of water and time is shown here. In fact, it might be more useful to use a coastal tide book to better illustrate this real-world experience. Pupils are to count the number...
Curated OER
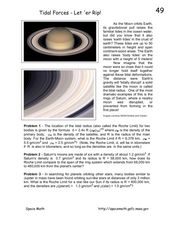
Tidal Forces-Let'er Rip!
In this tidal forces worksheet, high schoolers read about the gravitational pull from the moon that causes the ocean tides. Students solve 3 problems including finding the Roche or the tidal radius for the Earth and Moon, comparing the...
Curated OER
Time, Tide, and Quahogs
Learners read tide tables for Waquoit Bay as the simulate determining the best time to go clam digging for a Wampanoag clambake. They graph the tide tables while realizing that the tides a Waquoit Bay are one hour later than those at...
Curated OER
The Hudson's Ups and Downs
Even rivers have tides. Older elementary schoolers will discuss the Hudson River and how weather, water craft, and the ocean cause tidal fluctuation. They will examine a series of line graphs that depict tidal fluctuation, then analyze...
Curated OER
Catch a Wave
Students study low tides and how to calculate for fresh water. In this ocean science lesson, students pretend they are stranded on an island and must calculate low tide in order to source the fresh water aquifer. Students calculate how...
Curated OER
Seas in Motion
Young scholars analyze wave movement. In this Science instructional activity, students use items that float to observe waves and currents. Young scholars record and discuss their observations.
Bowland
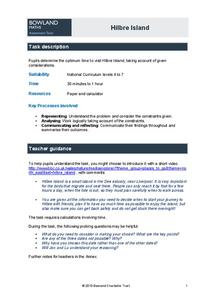
Hilbre Island
Young travelers plan a trip to Hilbre Island based on constraints on tides and time. They use a timeline to help determine the optimal day/time to make the trip.
Curated OER
Long Day?
Students become aware of the effects of tides on the Earth's rotation. In this tides instructional activity, students calculate the number of seconds lost over various periods of time.
Curated OER
The Hudson's Ups and Downs
Fifth graders practice interpreting line graphs of the Hudson River water levels to assess the tides and tidal cycles in the estuary. They explore how weather can affect water levels and tides and observe that high tides and low tides...
Curated OER
The Hudson's Ups and Downs-Hudson River Activity
In this Hudson River worksheet, students read a short passage about the river, compare graphs of water levels at different locations, label high and low tides on a graph and interpret, and answer comprehension questions based on several...
Curated OER
Maps and Modes, Finding a Mean Home on the Range
Fifth graders investigate data from maps to solve problems. In this data lesson, 5th graders study maps and collect data from each map. Students present their data in a variety of ways and calculate the mode, mean, median, and range.
Curated OER
Mayan Math
Fifth graders investigate the Maya's as mathematicians. In this Mayan math lessons, 5th graders work with the ancient Mayan numbering system by comparing it to the American Number System. They tell the differences and similarities...
Curated OER
Let the Rain Come Down!
Second graders construct a bar graph comparing local precipitation to that of the Yucatan. In this graphing activity, 2nd graders will use conversions and problem solving strategies.
Illustrative Mathematics
Mile High
What is the meaning of sea level? This resource helps your class understand the meaning of elevations above, below, and at sea level. Provides for good discussion on using positive and negative numbers to represent quantities in the real...
Curated OER
NIGHT AND DAY: DAILY CYCLES IN SOLAR RADIATION
Students examine how Earth's rotation causes daily cycles in solar energy using a microset of satellite data to investigate the Earth's daily radiation budget and locating map locations using latitude and longitude coordinates.
Curated OER
T3 Lesson Plan: Number 3
Sixth graders investigate local water. In this water cycle lesson, 6th graders take samples from surrounding water sources. Students record data from the samples, compare and graph the results.
Illustrative Mathematics
Offensive Linemen
Comparing college football teams, Division I is said to have heavier lineman than Division III. Your mathematicians are given data from two different divisions and will have to interpret a dotplot and calculate the difference in weight...
Curated OER
Algae Blooms
Your microbiologists explore a changing algae population and build an exponential function modeling algae concentration from the description given of the relationship between concentrations in cells/ml and days of rapid growth.
Mathematics Vision Project
Module 6: Trigonometric Functions
Create trigonometric functions from circles. The first lesson of the module begins by finding coordinates along a circular path created by a Ferris Wheel. As the lessons progress, pupils graph trigonometric functions and relate them to...
Mathematics Vision Project
Module 7: Trigonometric Functions, Equations, and Identities
Show your class that trigonometric functions have characteristics of their own. A resource explores the features of trigonometric functions. Learners then connect those concepts to inverse trigonometric functions and trigonometric...
Curated OER
Highs and Lows
Plot data using the number line and discuss how negative numbers are used in math and science. Sixth and seventh graders share their graph with the class and provide an explanation for their plotting.
Curated OER
Trigonometry Practice: Trigonometric Graphs #2
In this trigonometric functions worksheet, students solve 8 multiple choice and graphing problems. Students graph trigonometric functions given an equation and match graphs to a given scenario.
Other popular searches
- Gravity Tides
- Moon and Tides
- Ocean Tides
- Tidepools
- Tides and the Moon
- Worksheets on the Tides
- Tide Pools
- Moon Tides
- High Tide Zone
- Oceanography Tides
- Moon Tides
- Ocean Waves Tides Currents


