Pennsylvania Department of Education
Build What I've Created
n this geometric lesson, students define and identify two dimensional shapes based on their attributes. They complete worksheets based on the geometric concepts.
Curated OER
US Population 1982-1988
Your algebra learners make predictions using the concepts of a linear model from real-life data given in table form. Learners analyze and discuss solutions without having to write a linear equation.
EngageNY
Graphs of Exponential Functions
What does an exponential pattern look like in real life? After viewing a video of the population growth of bacteria, learners use the real-life scenario to collect data and graph the result. Their conclusion should be a new type of...
Curated OER
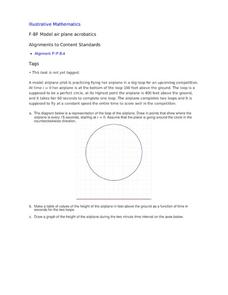
Model Air Plane Acrobatics
Your young airplane enthusiasts will enjoy this collaborative task of graphing an airplane's distance from the ground as it flies in a perfect circle. They will discover that they have graphed a sinusoidal function that comes from the...
Illustrative Mathematics
Fixing the Furnace
This comprehensive resource applies simultaneous equations to a real-life problem. Though the commentary starts with a graph, some home consumers may choose to begin with a table. A graph does aid learners to visualize the shift of one...
Space Awareness
The Thermal Layers of Oceans
How much does the sun heat up a lake or ocean? Scholars use a cup and a strong lamp to investigate the heat transfer and thermal layers in the ocean to come up with the answer. They collect data and graph it in order to better understand...
EngageNY
Constant Rate
Two-variable equations can express a constant rate situation. The lesson presents several constant rate problems. Pupils use the stated constant rate to create a linear equation, find values in a table, and graph the points. The resource...
Curated OER
Waves
Light waves and sound waves are the focus of this science lesson designed for 5th graders. Besides discovering how these waves travel, learners also discover the basic properties of waves, and analyze data tables and graphs. The...
NOAA
El Niño
El Nino, La Nina ... and the Santa Maria? The 11th installment of a 23-part NOAA Enrichment in Marine sciences and Oceanography (NEMO) program explains the mechanism of El Nino/Southern Oscillation. Pupils use previous data to determine...
Curated OER
Identifying Verb Tenses
How many different verb tenses are there? When do you use each? After introducing the different tenses with your upper elementary schoolers, have them read through a series of sentences, underline the verb in each sentence, and then...
Curated OER
How Much Will Movies Cost In The Future?
Young scholars use data collection and analysis, statistics, and probability in problem-solving situations and communicate the reasoning used in solving these problems.
Curated OER
Energy and Changes of State
Students complete a variety of labs to help them explain how energy affects the changes in states of matter. They also be required to collect and record data, graph data, and apply interpretations of that data.
Curated OER
In A Heartbeat
Learners discuss scatter plots then create a class scatter plot using their heart rate at rest and their heart rate after a few minutes of aerobic exercises. Students copy the points plotted as a class and create individual graphs...
Curated OER
Creating an Enzyme-Substrate Model
Students explore the reaction rates of an enzyme-mediated reaction through experimentation. In small groups, they use everyday objects to demonstrate the effects of environmental variables on enzyme function.
Students graph and...
Curated OER
Rover Races
Students identify the challenges encountered by astronauts in operating a planetary rover. In this space science activity, students create a rover using their team members. They follow a command sequence from the driver and navigate...
Curated OER
Wave Math
Students identify the different factors affecting the size and shape of ocean waves. In this math lesson, students calculate wave speed and wavelength given a mathematical formula.
Curated OER
A Picture's Worth a Thousand Words
Students analyze the numbers of male vs female administrators and teachers from their school. In this gender equality lesson plan, students use school yearbooks from the 1950's threw present to count how many male vs. female teachers,...
Curated OER
Hot n' Cold
Students keep a weather log. In this weather and temperature activity, students discuss the information that can be obtained from a map and lead into a discussion about temperature. Students watch a video about temperature and...
Curated OER
The Mathematical Dynamics of Celestial Navigation and Astronavigation
Students explore the different methods used in celestial Navigation and astronavigation. In this math lesson, students construct a sextant and demonstrate how it works.
Curated OER
The Amazing Heart
Students examine human blood flow by comparing the pulse of athletes. In this human body lesson, students discover the equation for finding the cardiac output from a human heart. Students identify heart rates of accomplished...
Curated OER
Weathering and Erosion
Students investigate how changes occur on the surface of the earth through erosion and glaciation. They observe what happens to salt and iron after they interact with water and vinegar, and analyze what occurs when water is sprinkled on...
Curated OER
Interpreting History With Artifacts: Mid to Late 1800s
Fourth graders study history though the exploration of artifacts. For this Civil War lesson, 4th graders examine artifacts such as sweet grass basket, spinning top, photos on tin, cast iron kettle, china"bone plate," bonnet, wooden...
Curated OER
Iditarod
Fourth graders, after reading "Woodsong" by Gary Paulsen, explore/research what an Iditarod is and then create a speech about their selected musher and present their new found information to their classmates. In addition, they...
Curated OER
Igneous Rocks
High schoolers focus on a study of igneous rocks. They see how igneous rocks are formed, and how to distinguish them from other types of rocks. A crystal-growing activity is present, and learners create drawings that show where each...
Other popular searches
- Tell Time 1 Hour Intervals
- Time Intervals in Math
- Math Time Intervals
- Telling Time Intervals
- Intervals of Time
- Time Intervals Lesson Plans


