Inside Mathematics
House Prices
Mortgages, payments, and wages correlate with each other. The short assessment presents scatter plots for young mathematicians to interpret. Class members interpret the scatter plots of price versus payment and wage versus payment for...
Curated OER
Trends in the Periodic Table
In this trends in the periodic table activity, students plot the ionization energy vs. atomic number and they plot atomic radius vs. atomic number of the first 20 elements. Students analyze their graphs and answer questions about the...
Curated OER
Using Excel to Draw a Best Fit Line
Students create line graphs for given data in Microsoft Excel. Students follow step by step instructions on how to create their graph, including how to create a trend line. Students print graphs without trend lines and manually draw...
Curated OER
Corporate Profits vs. Jobs
Bring the Occupy Movement debate to your classroom. This political cartoon analysis offers a chance for pupils to explore their personal ideas about corporate America and current economic issues. Background information is provided to...
Curated OER
Interesting Integers
Upper elementary and middle schoolers practice solving addition and multiplication problems with positive and negative numbers. They use a number line initially to help find a solution.
Curated OER
Describing Trends
In this describing trends worksheet, students read information about broadcast TV plus cable and satellite TV, observe an annual use of the media graph and describe the trends. Students also read a text about advertising, interpret a...
Curated OER
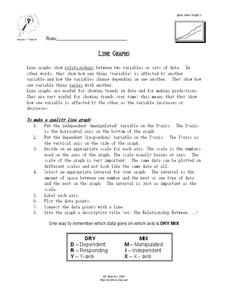
Line Graphs
In this algebra worksheet, students describe the relationship between a line graph and its data. They define the reasons line graphs are used and discuss increasing and decreasing lines. There is one involved questions, requiring several...
CCSS Math Activities
Social Security Trust Fund
Will Social Security still be around when you retire? Given data on the predicted balance of the social security fund over time, scholars plot the points on a coordinate grid and determine if a quadratic regression fits the data. They...
CCSS Math Activities
Scatter Diagram
Don't let a great resource scatter to the winds. Pupils analyze two sets of test scores on a scatter plot. They draw a line of best fit and use it to make predictions about the test scores. They also consider any apparent trends in the...
Intel
Track the Trends
Allow your classes to research what interests them. An engaging STEM lesson, the fourth in the series of six, asks individuals to choose a topic of interest and analyze the data through regression models. The regression equations allow...
EngageNY
Patterns in Scatter Plots
Class members investigate relationships between two variables in the seventh installment of a 16-part module that teaches scholars how to find and describe patterns in scatter plots. Young mathematicians consider linear/nonlinear...
EngageNY
Scatter Plots
Scholars learn to create scatter plots and investigate any relationships that exists between the variables with a instructional activity that also show them that statistical relationships do not necessarily indicate a cause-and-effect...
EngageNY
Mid-Module Assessment Task: Grade 8 Module 6
Make sure pupils have the skills to move on to the second half of the module with a mid-module assessment task. The formative assessment instrument checks student learning before moving on to the rest of the lessons in the unit.
NASA
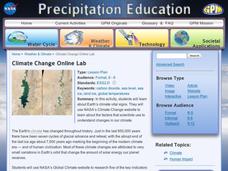
Climate Change Online Lab
What are the key indicators that show scientists that our planet is in the fastest warming trend ever? Learners go on a WebQuest to examine the evidence for themselves. Following several links to NASA sites, kids see how the global...
Curated OER
Deciding Which Type of Graph is Appropriate
For this graphing worksheet, learners read about line, bar, and pie graphs and then determine which graph is the best way to express data results. This worksheet has 3 short answer questions.
Curated OER
Life Expectancy at Birth
Learners create a line graph on the life expectancy for males and females in Canada. In this math and health lesson plan, students review table and graph terminology, create line graphs, and analyze the differences in life expectancy...
Curated OER
Is there Treasure in Trash?
More people, more garbage! Young environmentalists graph population growth against the amount of garbage generated per year and find a linear model that best fits the data. This is an older resource that could benefit from more recent...
Curated OER
Describing Business Trends
In this technology worksheet, students write e-mails that are focused upon the concept of describing business trends. The sheet contains some suggestions.
Curated OER
Line & Scatter (What Would You Use: Part 2)
High schoolers discuss line graphs and scatter plots and the best situations in which to use them. Using the graphs, they determine the type of correlation between variables on a scatterplot. They create a scatterplot and line graph...
Curated OER
How Long is the Line?
For this estimation worksheet, students take a trip to a specific destination and guess how long they'll have to stand in line before it becomes their turn. Students use estimation in a variety of scenarios.
Inside Mathematics
Population
Population density, it is not all that it is plotted to be. Pupils analyze a scatter plot of population versus area for some of the states in the US. The class members respond to eight questions about the graph, specific points and...
EngageNY
End-of-Module Assessment Task: Grade 8 Module 6
Test your knowledge of linear functions and models. The last installment of a 16-part module is an end-of-module assessment task. Pupils solve multi-part problems on bivariate data based on real-world situations to review concepts from...
Bowland
Fares Not Fair
What would be a fair fare for a taxi? to answer the questions requires young mathematicians to analyze data on fuel prices and taxi cab fares. They determine and justify a fair fare price.
Radford University
Connecting Scatter Plots and Correlation Coefficients Activity
Collect a variety of bivariate data. Groups determine sets of data that would provide a positive, negative, and no correlation. Team members gather their data through out the week. Scholars plot the data and determine the relationship...


