Howard County Schools
Planning for Prom
Make the most of your prom—with math! Pupils write and use a quadratic model to determine the optimal price of prom tickets. After determining the costs associated with the event, learners use a graph to analyze the break even point(s).
Michigan State University
Bug Lyphe!
Introduce ecology classes to biodiversity and interdependence in ecosystems with a PowerPoint presentation. Then, they get up-close and personal with the invertebrate world by collecting insects, classifying them, and graphing their...
Georgia Department of Education
Math Class
Young analysts use real (provided) data from a class's test scores to practice using statistical tools. Not only do learners calculate measures of center and spread (including mean, median, deviation, and IQ range), but...
Achieve
Greenhouse Management
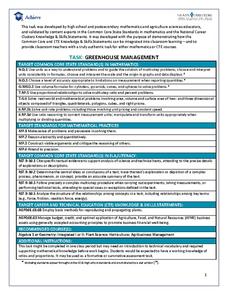
Who knew running a greenhouse required so much math? Amaze future mathematicians and farmers with the amount of unit conversions, ratio and proportional reasoning, and geometric applications involved by having them complete the...
Statistics Education Web
Consuming Cola
Caffeine affects your heart rate — or does it? Learners study experimental design while conducting their own experiment. They collect heart rate data after drinking a caffeinated beverage, create a box plot, and draw conclusions....
Achieve
BMI Calculations
Obesity is a worldwide concern. Using survey results, learners compare local BMI statistics to celebrity BMI statistics. Scholars create box plots of the data, make observations about the shape and spread of the data, and examine the...
Chicago Botanic Garden
Historical Climate Cycles
Ice core samples give scientists access to climates of old—those from more than 800,000 years ago. Through an analysis of various temperature graphs from ice cores, tree rings, and weather stations, scholars compare historical climates...
Utah Education Network (UEN)
Ratio Relations
At this rate, the class will be experts on ratios and rates in no time. A class workbook teaches individuals about ratio language, using tables and tape diagrams to find equivalent ratios, and solving ratio problems. They then discover...
Illustrative Mathematics
Electoral College
A cross-curricular resource that takes the electoral votes and allows your learners to organize and analyze the data. Young voters can determine which states are more influential and interpret the dotplot provided for more data....
Teach Engineering
Penny Perfect Properties (Solid-Liquid Interations)
I can get more water to stay on a penny than you can! Collaborative pairs determine the volume of liquids that can be contained on the surface of copper pennies and plastic coins. The pairs analyze their results using graphs and go on to...
Statistics Education Web
Who Sends the Most Text Messages?
The way you use statistics can tell different stories about the same set of data. Here, learners use sets of data to determine which person sends the most text messages. They use random sampling to collect their data and calculate a...
American Statistical Association
EllipSeeIt: Visualizing Strength and Direction of Correlation
Seeing is believing. Given several bivariate data sets, learners make scatter plots using the online SeeIt program to visualize the correlation. To get a more complete picture of the topic, they research their own data set and perform an...
Balanced Assessment
Number Game
It's all in the numbers! Create a mathematical model to analyze a number game and develop a winning strategy. Using a given numerical pattern, scholars write an expression to model the scenario. They then interpret the pattern of the...
Curated OER
Pictograph to Bar Graph
Second graders explore organizing data to make it useful for interpreting picture graphs and bar graphs. They use Graphers software to create a pictograph and a bar graph.
Curated OER
Hopes and Dreams: A Spreadsheet Lesson Using Excel
Fourth graders read "The Far Away Drawer" by Harriet Diller and discuss the story as a class. After discussion, 4th graders create a t-shirt GLYPH about their hopes and dreams,share their information with the class and create spreadsheets.
Curated OER
Show Me!
Students analyze and interpret graphs. In this graphing instructional activity, students view a video and construct their own graphs (line, circle, bar) from given sets of data.
Curated OER
Dealing With Data
Students collect, organize, and display data using a bar graph, line graph, pie graph, or picture graph. They write a summary describing the data represented and compare the graph to another graph in the class.
Illustrative Mathematics
Interpreting the graph
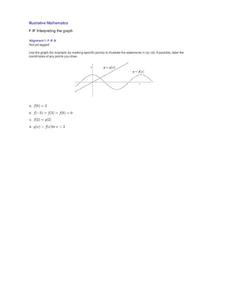
The purpose of this exercise is to give practice in reading information about a function from its graph. Learners are given graphs of two functions on the same axes. The task is to locate and label various key points on the graph that...
Curated OER
Graphs: All About Our Class
Students respond to survey questions, discuss results, brainstorm ways to represent survey information, and create table of class results. They find mean, range, and percentages, and create graph to display results.
Curated OER
Graphing and Interpreting Linear Equations in Two Variables
Graph linear equations using a table of values. Learners solve equations in two variables using standard form of an equation. They identify the relationship between x and y values.
Curated OER
Aerosol Lesson: Science - Graphing SAGE II Data
Students examine and plot atmospheric data on bar graphs.
Curated OER
Solving Linear Systems by Graphing
A worksheet that offers four problems to practice solving simultaneous equations by graphing. Equations are presented in slope-intercept form or standard form. Problems include two with unique solutions, one with no solution, and one...
Curated OER
Using the Landscape Picture Map to Develop Social Studies Skills
Enhance your class' geography skills using this resource. Explore a variety of concepts including production and distribution, and people and the environment. Learners make predictions and identify locations on maps. This is a creative...
Kenan Fellows
Dinner Party: Using Pattern Trains to Demonstrate Linear Functions
Nothing fancy here ... just your run-of-the-mill Algebra party! Learners explore the patterns of linear functions while designing seating arrangements for a dinner party. Comparing the number of tables to the perimeter of the combined...


