Science 4 Inquiry
The Ups and Downs of Populations
As the reality of population decline across many species becomes real, pupils learn about the variables related to changes in populations. They complete a simulation of population changes and graph the results, then discuss limiting...
Texas Instraments
Getting Started Dilemma
Get out those thinking caps and apply graphing functions to a real-world problem. Use the TI-83 graphing calculator to evaluate algebraic expressions that are imbedded in a series of real-world scenarios. A great lesson!
Teach Engineering
Mechanics of Elastic Solids
Make the connection between Hooke's law and elasticity with an activity that introduces the class to the behavior of elastic materials. The resource defines stress and strain to calculate the modules of elasticity of...
California Education Partners
Linflower Seeds
How does your garden grow? Use proportions to help Tim answer that question. By using their understanding of proportional relationships, pupils determine the number of seeds that will sprout. They create their own linear...
West Contra Costa Unified School District
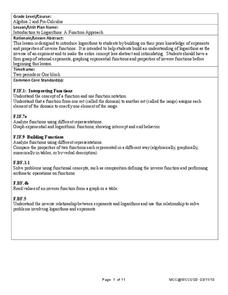
Introduction to Logarithms
Build on pupils' understanding of inverse functions by connecting logarithmic functions to exponential functions. This activity allows individuals to see graphically the inverse relationship between an exponential and logarithmic...
Mathematics Vision Project
Module 1: Sequences
Take steps into sequences. An 11-lesson unit builds upon pupils' previous understanding of writing expressions to develop the idea of sequences. The resource explores both arithmetic and geometric sequences using recursive and explicit...
CK-12 Foundation
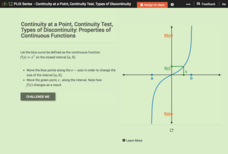
Continuity at a Point, Continuity Test, Types of Discontinuity: Properties of Continuous Functions
Take a closer look at continuous functions within given intervals. Using the parent cubic function, learners explore properties of continuous functions on intervals. Pupils interpret the Intermediate Value Theorem and the Extreme Value...
Intel
Choreographing Math
Leaners investigate families of linear functions through dance. They choreograph dance moves to model nine unique linear functions of their choosing. Using their dance moves, teams create a video presentation complete with music and...
Polar Trec
Global Snow Cover Changes
Snow is actually translucent, reflecting light off its surface which creates its white appearance. Pairs or individuals access the given website and answer questions about snow cover. They analyze graphs and charts, examine data, and...
Concord Consortium
Cheetah's Lunch
Run like a cheetah. A performance task challenges pupils to solve several different problems involving the speed of a cheetah. Given information for scenarios where the cheetah chases its prey, they determine if the big cat is fast enough.
Curated OER
Food chains at sea
Fifth graders interpret a table of data about food chains in the ocean. They create a food chain to represent the information on the table. Periwinkles eat seaweed, and crabs eat periwinkles - so who eats crabs? Extend the activity with...
Curated OER
Excel temperature Graphs
Students gather data about the weather in Nome, Alaska. For this Nome Temperature lesson, students create an excel graph to explore the weather trends in Nome. Students will find the average weather and add a trend line to their...
Pennsylvania Department of Education
Using the Coordinate Plane in Problem Solving
Fifth graders practice solving problems. In this fraction and decimal lesson, 5th graders recognize the relationship between fraction and decimals. Students estimate problem results and write expressions to use for problem...
Curated OER
Chocolate Preferences Voting and Graphing Techniques
Students practice sampling and graphing techniques. In this data collection and interpretation lesson, students write and conduct surveys about chocolate preferences and then collect their data. Students graph the data in order to...
Curated OER
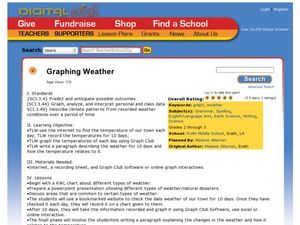
Graphing Weather
Students make a graph. In this weather lesson, students fill in a KWL chart about different types of weather. Students watch a PowerPoint presentation about weather and natural disasters and where these types of weather are common....
Curated OER
Storybook Character Graph
First graders dress as their favorite storybook character. They draw a self-portrait, then place the drawing on a graph.
Curated OER
Farm Stories, Animal Webbing, Favorite Farm Animal Graph
Students brainstorm animals they would expect to see on a farm. They save these on a Kidspiration web. Students watch or read a farm story. They discuss the characters. Students vote for their favorite farm animal and crate a graph using...
Curated OER
Forces and Graphing
Students analyze graphs to determine relationships between variables and rates of change. They determine the basic concepts about static reaction forces. They determine the slope and equation of a line.
Curated OER
Graphing Linear Motion
In this graphing linear motion worksheet, students answer 20 questions about velocity of objects, the distance they travel and the time. They interpret a graph of position vs. time and identify the velocity at certain point on the graph.
Curated OER
Monopoly Graphs
Students relate the concepts of linear functions to the game of monopoly. In this algebra lesson, students solve problems with ratio and proportion. They collect data and graph it.
Curated OER
My Own Private Idaho; Using Social Studies to Explore Idaho
Young scholars engage in several activities to explore Idaho and Social Studies themes. Using an variety of media, students become familiar with Idaho's geography and geology.
Curated OER
Using Vegetation, Precipitation, and Surface Temperature to Study Climate Zones
Students begin their examination of the climate zones found around the world. Using a software program, they identify the relationship between the vegetation, climate and temperatures of the different zones. They also plot coordinates...
Curated OER
Great Basin Tribes- Use of Land for Sustenance
Students explore four Native American tribes from Nevada. In this Native American history lesson, students identify and generate important corresponding attributes of the Southern Paiute, Northern Paiute, Washoe, and Western Shoshone...
Curated OER
Oil and its Everyday Uses
Explore the properties of oil through an experiment. They use the scientific process to investigate oil, participate in experiments, watch videos,and use information from the internet to determine how oil has changed our...


