Curated OER
Graphs of Functions
For this using function tables to problem solve worksheet, students interpret and complete function tables to solve problems. Students solve six word problems.
Curated OER
Balancing Equations and Using a Pyramid
Sixth graders complete worksheets and make journal entries to interpret mathematical expressions about the pyramids. In this equality by balancing equations lesson, 6th graders participate in groups or by themselves to complete exercises...
Curated OER
Zebra Mussel Population Simulation
Students are taught how to format and enter data into an Excel spreadsheet. They make a graph, and interpret graphed data. Students discuss the possible impacts of zebra mussels on the Hudson river. They graph zebra mussel data.
Curated OER
Which Fish Where?
Here is a lesson plan outline that prompts elementary young scholars to graph and analyze data regarding fish caught along the Hudson River. They will review vocabulary and complete 2 worksheets which can be accessed by clicking on the...
Curated OER
Investigating Velocity Effects at Takeoff
Students use, with increasing confidence, problem-solving approaches to investigate and explain mathematical content. They make and test conjectures. They use tables and graphs as tools to interpret expressions, equations, and inequalities.
Curated OER
Creating Bar Graphs and Pie Graphs
Second graders observe a demonstration of the creation of a bar graph and a pie graph of their favorite colors. They gather information about various topics from their classmates, then organize the information, creating a bar and a pie...
Curated OER
Creating Bar Graphs
Fifth graders design and label a bar graph using data taken from a class survey. They observe a teacher-led lecture, write and conduct their survey, and create a bar graph that includes identification of the minimum, maximum, mode,...
Curated OER
Introduction to Bar Graphs Lesson Plan
Students organize and interpret data using bar graphs.
Curated OER
Usage and Interpretation of Graphs
Learners review graphing and use processing skills to solve problems.
Curated OER
Fast Food Survey Using Bar Graphs
Second graders conduct survey and sort data according to categories, construct bar graph with intervals of 1, and write a few sentences about their graphs.
Curated OER
Reading a Graph: Azimuth Range vs. Day in Barrow Alaska
Students practice reading a graph while doing story problems. They determine the x and y intercepts and calculate the slope. They also practice writing linear equations.
Curated OER
Getting Graphs: Researching Genealogy-A Piece of Pie
Third graders research their genealogy. In this math lesson, 3rd graders collect data and create graphs and charts. A presentation of their findings is given.
Curated OER
Using Oral History to Understand Immigrant History
Students use oral history to comprehend how life chaned for men, women, and childern when they immigrated to the United States. Students conduct interviews with immigrants in an attempt to interpret hardships, lifestyles, careers, and...
Curated OER
Bar Graphs Using M & Ms
Fifth graders observe an overhead of a graph on which M & Ms have been poured out. A volunteer comes up and separates the colors writing on the overhead how many there were of each color and another person labels the graph's title....
Curated OER
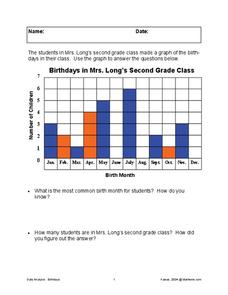
Birthday Graph
In this graphing worksheet, students interpret a graph of "birthdays in Mrs. Long's second grade class" to answer 2 related questions.
Curated OER
Using My Nasa Data To Determine Volcanic Activity
Young scholars use NASA satellite data of optical depth as a tool to determine volcanic activity on Reunion Island during 2000-2001. They access the data and utilize Excel to create a graph that has optical depth as a function of time...
Curated OER
Graphing Predator/Prey Data
Students use data from the Camouflage Game (played with red and green yarn caterpillars) to create a composite bar graph to display the collected data. They interpret the data and form a conclusion based on the graphs. Teachers may use...
EngageNY
Modeling with Quadratic Functions (part 1)
Relevance is key! The resource applies quadratic modeling by incorporating application of physics and business. Pupils work through scenarios of projectile motion and revenue/profit relationships. By using the key features of the graph,...
EngageNY
Polynomial, Rational, and Radical Relationships
This assessment pair goes way beyond simple graphing, factoring and solving polynomial equations, really forcing learners to investigate the math ideas behind the calculations. Short and to-the-point questions build on one another,...
Noyce Foundation
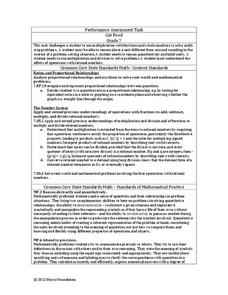
Cat Food
Determine the right mix of cans of cat food. The resource consists of an assessment task to determine the cost to feed two cats for a specific number of days and requires scholars to interpret remainders within a context....
Virginia Department of Education
Normal Distributions
Pupils work to find probabilities by using areas under the normal curve. Groups work to calculate z-scores and solve real-world problems using the empirical rule or tables.
American Statistical Association
You and Michael
Investigate the relationship between height and arm span. Young statisticians measure the heights and arm spans of each class member and create a scatter plot using the data. They draw a line of best fit and use its slope to explain the...
Firelands Local Schools
Exponential Growth and Decay
How can you safely model exponential growth and decay? A hands-on activity uses candies to model not only exponential decay, but also exponential growth. Exponential equations are fitted by hand and by use of a calculator...
Achieve
Stairway
It's the stairway to learning! Scholars research all aspects of building a staircase. Using information from building codes, they write and graph a system of inequalities to analyze the constraints. The completed project is a scale model...


