Curated OER
Twelve Days of Christmas
Young scholars create charts and graphs using a spreadsheet. They chart the number of each gift given day by day from the song, "The Twelve Days of Christmas." They create a bar graph and a circle graph from their data on the spreadsheet.
Curated OER
Graphing the Elephant Seal Population Data
Students are able to graph data that they generated in the elephant seal exercise using proper format and labeling. They are able to interpret the graphs they created and make A) conclusions, and B) predictions based on that graph.
Curated OER
Reaching New Heights
Students explore the relationship between two variables. Students measure their arm span and height. They gather this class data to design a scatter plot. Students interpret the meaning of individual coordinates and the overall graph....
Curated OER
What's Your Favorite Planet?
Fourth graders interpret a graph and make correlations using data. After taking a class survey, 4th graders create a class graph of their favorite planets. Working in small groups, they interpret the information and create at least ten...
Curated OER
Investigating Motion, Forces, and Energy Lab Book
Eighth graders create their own experiements using toy trucks, cars or balls to measure the time it takes two of them to travel 5 meters, as well as at each 1 meter interval. They make use computers to make a time/distance graph and...
Curated OER
Groups Coming to America
Fifth graders use text or other references to locate different types of information about the Mayflower and pilgrims. They create a presentation for lower elementary classes about the Pilgrims.
Curated OER
Exploring Scale
Sixth graders discuss how the scale and type of graph can change how the data appears. With a partner, they identify all the information about the graph in a specific amount of time and record them in a journal. To end the lesson plan,...
Curated OER
McCadam's Quarterly Report
Fourth graders problem solve a problem from a local business using data, generating graphs, and draw conclusions. They submit their findings in a business letter format with feed back from a company's plant manager.
Curated OER
Math & Social Science
Students are given data and are to calculate averages and yearly totals of how many cars travel the Tacoma Narrows Bridge. They also make a graph of the data.
Curated OER
Data Days
Sixth graders practice collecting, organizing and displaying data. They create circle, bar, line and picto graphs. They analyze data in small and large sample groups.
Curated OER
Manatee Awareness Survey
Students examine the public's awareness of manatees by taking a survey. They display the results of the survey as a graph.
Curated OER
Viewing Tubes
Students complete a lab in order to discover if the length of a viewing tube, its diameter, or the distance from an object affect the type of data collected and the resulting graph.
Curated OER
Water You Can Use from the Air Conditioner
Students work together to research water quantity, quality and safety standards. They complete a lab to discover how to use the water from an air conditioner. They write a paper to show their findings.
Curated OER
Ocean Botttom Profile
Students interpret a graph of ocean depths and topographic features. This task assesses students' abilities to interpret figures, organize and represent data, apply knowledge of scale to a profile, and apply theoretical knowledge.
Curated OER
Between The Extremes
Students analyze graphs for specific properties. In this algebra lesson, students solve equations and graph using the TI calculator. They find the different changes that occur in each graph,including maximum and minimum.
Curated OER
Don't Lose Your Load!
Students create graphs using collected data. In this algebra lesson, students use spreadsheet in Excel to create graphs to interpret their data and make predictions. They rewrite word problems using algebraic expressions.
Curated OER
The Treasure Map
Third graders problem solve using drawings and map interpretations. They preview graphs and Cartesian geometry. They follow directions on a map using a grid and compass references while simulating they are reading a pirate map.
Curated OER
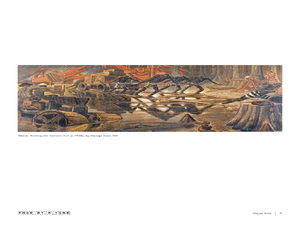
Analyzing Visual Symbols
Young scholars analyze and identify visual symbols in everyday life and during a museum visit. In this visual symbol lesson, students study associated vocabulary such as analyze and interpret. They find and note attention getting symbols...
Curated OER
Tune...Um!
Learners collect real data on sound. In this algebra lesson, students use a CBL and graphing calculator to observe the graph created by sound waves. They draw conclusion about the frequency of sound from the graph.
Curated OER
Valentine Candy Count
Young scholars investigate what color Valentine Candy is found more often than any other in a standard bag of "Valentine Conversation Hearts." They sort, classify and graph their findings.
Curated OER
Discovering Shoes, Step by Step
Students discuss and write about their interpretations of the art. They compare and contrast the numerous types of shoes and how they are used in a certain time and place. Students memorize the Shel Silverstein's poem, "Ickle Me, Pickle...
Curated OER
How Many Cells Are Born in a Day?
Students predict the number of cells after a series of cell divisions. In this cells lesson students create a graph of their results and create a patterned drawing.
Curated OER
Weather Report Chart
Students complete a weather report chart after studying weather patterns for a period of time. In this weather report lesson, students measure temperature, precipitation, cloud cover, wind speed, and wind direction for a month. Students...
Curated OER
Confidence Levels
Learners collect data and graph it. In this statistics instructional activity, students rate confidence levels by collecting data and analyzing it. They graph their findings on the Ti calculator.


