Federal Reserve Bank
Creating a Budget
Learning to create and maintain a budget is an important life skill. Guide individuals in the discovery of their spending habits and how to track them. They then use what they learned to create a budget and make decisions on where they...
Nuffield Foundation
Making a Calibration Curve for Starch Concentration
How well can your class concentrate on solutions? Scholars use colorimeter absorption to explore a starch concentration calibration curve. They add iodine to different starch solutions to see how the concentration of the solution changes.
Virginia Department of Education
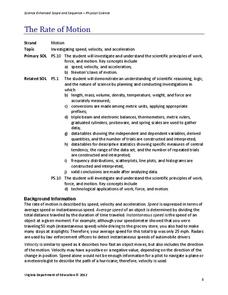
The Rate of Motion
How much time does it take to jump over three balloons? Pupils calculate the speed of tasks that require different motions. They determine motions for tasks such as walking, skipping, hopping, and jumping before creating a spreadsheet...
Curated OER
Backyard Birds: Who's Who Out There?
Young scholars practice techniques of field observation and data-gathering while studying local bird population, describe ecosystem as complex combination of elements, which can affect or be affected by each other, and determine effects...
Curated OER
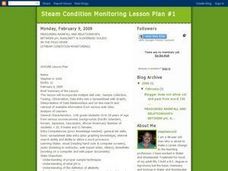
Measuring Rainfall and Relationships Between pH, Alkalinity and Suspended Solids in the Pago River
Eleventh graders test the pH and alkalinity of Pago River. In this ecology lesson, 11th graders collect data and use spreadsheet to graph results. They analyze and share their findings with the class.
Curated OER
Fruit Loop Graphing
Fifth graders interpret data and create graphs. Given Fruit Loops, they sort and classify according to color. Using spreadsheet technology, 5th graders record their data and create bar and circle graphs. Students analyze data and...
Curated OER
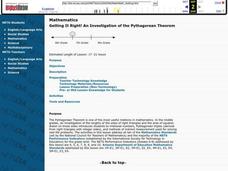
Getting It Right! An Investigation of the Pythagorean Theorem
Learners construct a variety of right triangles using a right-angled set square, cutting corners from pieces of paper or cardboard, and using dynamic geometry software. They measure the sides of these various right triangles and record...
California Academy of Science
Optimal and Sustainable: Renewable Energy Revamp
More than 100 cities around the world have shifted from fossil fuels to renewable energy sources. Scholars investigate a city wanting to make this switch, but needs help determining how to make the shift. Groups consider all options,...
Curated OER
Graphing Favorite Fruit
Third graders take poll and sort data, enter the data to create a spreadsheet and create bar and pie graphs.
Curated OER
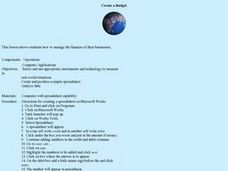
Create a Budget
Students develop a budget spreadsheet to manage finances for their business. In this finance activity, students use a spreadsheet program to create a budget with credit and debit columns. There are step-by-step directions for creating...
Curated OER
T-Shirt Lettering
Students determine the cost of a t-shirt using a variety of mathematical operations to solve problems. Then they use a spreadsheet to calculate the cost of lettering a t-shirt and display this information in a graph.
Curated OER
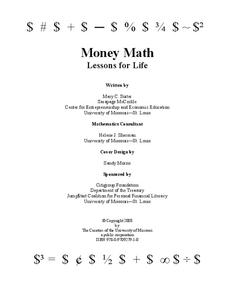
Money Math: Lessons for Life
Students develop a budget for a college student using all of the influences that the student would have. In this budgeting lesson plan, students use real life examples to create a budget spreadsheet. Students read and study sample...
Curated OER
A Line Graph of the Ocean Floor
Students develop a spreadsheet and import the information into a line graph. In this spreadsheet and line graph lesson plan, students develop a spreadsheet of ocean depths. They import the information into a word processed document. They...
Curated OER
State Economy Chart
Fifth graders research and record statistics on the economy of an assigned state. They create a spreadsheet in Excel to report the data and a 3D Pie graph using the Chart Wizard in Excel to represent their states' data.
Curated OER
Weather
Students create a spreadsheet and chart using data collected. In this weather lesson plan, students select five cities from their state, including the city they live in. Students take daily temperature readings from all five cities. ...
Curated OER
Which Amusement Park Would You Choose?
Students analyze data related to amusement parks and create a spreadsheet to display the data. They read the data and predict which amusement park they think is safer, create a spreadsheet and graph, and write a proposal based on their...
Curated OER
Calculating Profits from Selling Virtual Lemonade
Students set up and collect data for a virtual lemonade stand. In this entrepreneurship, economics, and technology instructional activity, students purchase ingredients, determine costs, and set up a virtual lemonade stand. Students...
Curated OER
Carbon Dating
Simulate C-14 decay using M&M and Reese's Pieces candies. In this scatter-plot lesson, students perform an experiment to simulate the half life of C-14. Information is plotted on a scatter-plot. Students answer four comprehension...
Curated OER
The Egg Drop
High schoolers design and create a container that allows a raw egg to drop from the second floor of a building without breaking. They develop and compute an invoice for project expenses using spreadsheet software. Students role-play a...
Curated OER
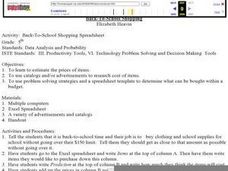
Back-To-School Shopping
Fifth graders estimate the prices of items to be bought for back to school. They use catalogs and/or advertisements to research the cost of each of the items. They use problem solving strategies and a spreadsheet template to determine...
Curated OER
Basic Excel
Students explore basic Excel spreadsheets. In this spreadsheet lesson plan, students enter Alaska weather information and perform calculations. Students title the columns on the spreadsheet and format the cells. Students complete...
Curated OER
Correlation of Variables by Graphing
Middle and high schoolers use a spreadsheet to graph data. In this graphing lesson, learners determine how two parameters are correlated. They create a scatter plot graph using a computer spreadsheet.
Curated OER
Haber's Process- A Computer Simulation
Young scholars use an on line simulation to produce ammonia using Haber's process. In this Haber's process lesson plan, students use a spreadsheet to manipulate the pressure, temperature and catalysts used in the production of ammonia....
Curated OER
Yellow Pages Ad-dition
Students determine the revenue generated by sample pages from the Yellow Pages. They discuss the value of advertising a business in this venue. They use the local telephone directory and some fictitious ad rates to lead their inquiry.


