Balanced Assessment
Books from Andonov
To examine mathematical functions in a modeling situation pupils combine quadratic and step functions to represent a presented scenario. They both graph and write a function to represent data shown in a table.
EngageNY
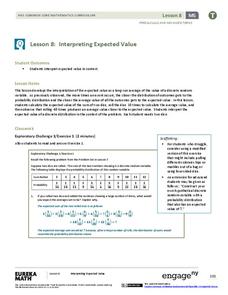
Interpreting Expected Value
Investigate expected value as a long-run average. The eighth installment of a 21-part module has scholars rolling pairs of dice to determine the average sum. They find aggregate data by working in groups and interpret expected value as...
CCSS Math Activities
Smarter Balanced Sample Items: 6th Grade Math – Target G
Making money and saving money turn into high interest topics for sixth graders. Grade 6 Claim 1 Item Slide Shows use these topics in a presentation with math practice problems. The questions require applying knowledge of algebraic...
EngageNY
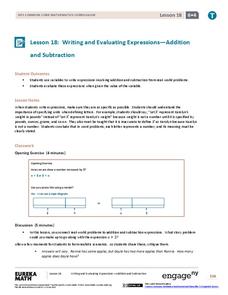
Writing and Evaluating Expressions—Addition and Subtraction
Let Y represent Yes to using an excellent resource. Pupils first learn to define variables using a complete description in the 19th part in a series of 36. They write expressions involving addition and subtraction in real-world contexts...
California Education Partners
T Shirts
Which deal is best? Learners determine which of two companies has the best deal for a particular number of shirts. They begin by creating a table and equations containing each company's pricing structure. Individuals finish the seventh...
Curated OER
VARIABLES AND PATTERNS, USE AFTER INVESTIGATION THREE. DISCRETE OR CONTINUOUS LINEAR RELATIONS.
Learners discover for which kind of linear function is appropriate to use the "scatter" or the "connected" term. In this lesson, students investigate functions using variables, patterns book, graph paper, rulers and the graphit program.
Curated OER
Variables and Functions
In this algebra learning exercise, 5th graders solve 6 word problems by finding the value of variable in function tables. They use the information to solve the problems.
Curated OER
Function Tables
For this function tables worksheet, students analyze 6 different function tables to determine the rule that applies to each table. The data in the table involves 2 variables and the rule is either addition, subtraction, multiplication...
Curated OER
Function Tables
For this function tables practice worksheet, students use their problem solving skills to solve 12 problems that require them to determine the rule followed in each of the function tables.
Curated OER
Graphing Situations without a Table
Students graph a line without making a table of vales. In this algebra instructional activity, students are given a verbal scenario and asked to write a linear functions representing the scenario and graph it on a number line without...
Curated OER
Graphing
In this graphing worksheet, students solve and graph 10 different problems that include determining various coordinates and the slope. First, they use the table to write the x and y coordinates for each point on the graphs. Then,...
Curated OER
Graphing Linear Equations Cards
OK, so maybe graphing linear equations can be fun. This activity includes a set of linear equation cards to be cut and place face up on a table. Learners pick a card and match it to the correct graph card. This is a really fun way to...
Curated OER
Equation Word Problems, Vol. 2
Use this equations worksheet to have your learners solve word problems containing equations with variables. They complete 10 multiple choice questions.
Charleston School District
Graphing Functions
How do letters and numbers create a picture? Scholars learn to create input/output tables to graph functions. They graph both linear and nonlinear functions by creating tables and plotting points.
Bonneville
Creating the Most Effective Solar Heater
If changing one variable can improve a design, why not try changing more? Using the results from the previous activity, scholars decide on the variables that caused the most improvement in the effectiveness of the solar heater. They take...
Benjamin Franklin Tercentenary
From Ben’s Pen to Our Lives
What would Ben do? Jumping off from the pseudonymous letters Ben Franklin fooled his older brother into publishing when he was still a teenager, young literary lovers dive into acting, writing, and addressing a local issue with wit and...
EngageNY
Relationships Between Two Numerical Variables
Is there another way to view whether the data is linear or not? Class members work alone and in pairs to create scatter plots in order to determine whether there is a linear pattern or not. The exit ticket provides a quick way to...
Illustrative Mathematics
Chocolate Bar Sales
In this real-world example, algebra learners start to get a sense of how to represent the relationship between two variables in different ways. They start by looking at a partial table of values that define a linear relationship. They...
Curated OER
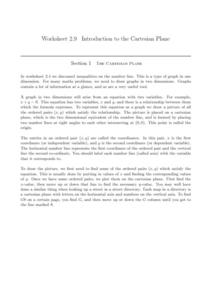
The Cartesian Plane
Learners solve and complete 22 various types of problems. First, they find the gradients of the lines and plot the given points. Then, they complete the table of values for each equation and use the table to draw the graph.
Willow Tree
Linear Relationships
There's just something special about lines in algebra. Introduce your classes to linear equations by analyzing the linear relationship. Young mathematicians use input/output pairs to determine the slope and the slope-intercept formula to...
Curated OER
Integer Solutions to Inequality
When is the last time you assigned your students only one problem? This seemly simple problem requires learners think like a mathematician and reason about how to solve this compound inequality in one variable. More than just using...
Curated OER
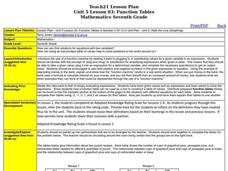
Function Tables
Students identify function using tables of data. In this algebra instructional activity, students create a tale of point and plot on a coordinate plane. They analyze the graph as being a function or not.
Curated OER
Algebra: Variables and Functions
In this algebra worksheet, students complete 10 function tables in which values for x are plugged in to an equation and the value of y is determined. There are no examples.
Houghton Mifflin Harcourt
Write Function Rules Using Two Variables
Fabulous functions are the focus of this handout. Middle school math pupils complete input/output tables and answer questions about the values. Each of the three equations contains two variables. This simple worksheet would be useful as...


