Curated OER
The Water Cycle
Students create an "animated" water cycle wheel that illustrates where water comes from and where it goes.
NOAA
Ground-truthing Satellite Imagery with Drifting Buoy Data
Ground-truthing ... is it even a word? The last installment of a five-part series analyzes how scientists collect sea surface temperature data. Scholars use government websites to compare temperature data collected directly from buoys...
NASA
Christa's Lost Lesson: Effervescence
How are chemical reactions affected by gravity? Learners explore the phenomenon of effervescence as part of the Christa's Lost Lessons series. They compare findings in an experiment on effervescence to a video of a similar experiment in...
Science Geek
Element Classes
Introduce your young chemists to alkali metals, alkali earth metals, transition metals, metalloids, nonmetals, halogens, and noble gasses with a presentation that explains the classes of elements and a few facts about each.
Sunburst Visual Media
Clouds
Support science instruction with a combination of engaging activities and skills-based worksheets that focus on clouds. Learners take part in grand discussions, write an acrostic poem, complete graphic organizers, solve word...
Curated OER
How Does Vegetation Decrease Erosion?
In this erosion activity, students will compare what happens to soil when water flows over soil with no vegetation and soil with vegetation. Then, students will complete four short answer questions.
Curated OER
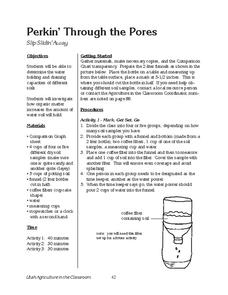
Perkin' Through the Pores
Students investigate how organic matter increases the amount of water soil will hold. In this water soil lesson plan, students use soil and measure water amounts using organic matter. Students measure the water holding capacities.
Curated OER
How Many Drops of H2o Can Fit on a Penny?
In this properties of water instructional activity, students explore the surface tension and cohesion properties of water compared to other liquids in a 2 part experiment.
Curated OER
Barrier Islands
Third graders explore how barrier islands work. For this erosion lesson, 3rd graders create barrier islands in stream tables and simulate wave action to see how it affects their island.
Curated OER
The Open Ocean, What is it and How Does it Change?
Students investigate the ocean environment. In this ocean lesson plan, students discover the physical properties of the ocean. Over two days, students work in small groups investigating ocean maps and creating water currents.
Curated OER
Its OK To Be a Clod
Middle schoolers describe factors that affect the solubility of a chemical substance in seawater. In this sea environment lesson, student explain how information on the solubility of a substance can be used to measure water currents....
Curated OER
Making a Water Filter
Fifth graders draw a plan that they think will clean the sludge in a jar. Students construct the treatment system they designed, take a bottle of sludge to the system and try it out, writing down what happened.
Curated OER
Water in the Texas Coastal Basins
Students, after researching a Texas coastal basin, map and graph the information they collect and then translate it into a short report to be presented to their classmates. They brainstorm unique ways to maintain Texas estuaries as well...
Curated OER
Geology Project Notes
In this geology worksheet, students fill in notes using a variety of resources. Students answer questions as it relates to geology, soil erosion, mass movement, and deposition. Students research information about the presented aspects of...
Creative Chemistry
Displacement Reactions of the Halogens
During this lab activity, chemists discover the reactivities of chlorine, bromine, and iodine as examples of the halogens. They use a displacement reaction as a test by adding other compounds and observing for a color change. The lab...
Creative Chemistry
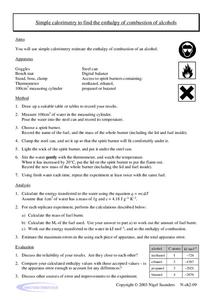
Simple Calorimetry to Find the Enthalpy of Combustion of Alcohols
Accomplished chemistry learners set up a calorimeter and measured the energy released by various alcohols: methanol, ethanol, and either propanol or butanol. Lab masters will first need to design their tables for recording data. Consider...
Curated OER
Periodic Behavior of Oxides
Learners investigate the properties of oxides and observe their periodic trends. In this behavior of oxides lesson plan, students experiment with metallic oxides and non-metallic oxides to determine if they are acid, basic or amphoteric...
Curated OER
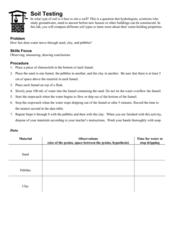
Soil Testing
Earth science learners experiment with the water-holding properties of sand, pebbles, and clay. They apply their findings to the building of a well. This activity is engaging and tactile, and it demonstrates the importance of considering...
American Chemical Society
Using the Combining Test to Identify Unknown Liquids
Once investigators have learned how their mystery liquids interact with water during the preceding activity, they now use their observations to identify them. This is an ideal conclusion to the mini unit on the properties of water.
PHET
Planet Designer: What’s Trending Hot?
Excite scholars to design their own planet in this first of five lessons. The lesson starts with a pre-activity assessment, a complete lesson plan that is easy to implement, and a post-activity assessment that would look great...
PHET
Planet Designer: Martian Makeover
Mars used to have liquid water, can you make it come back? Use the lesson plan and simulation to understand why Mars lost its magnetic field, why atmosphere is important, and what gravity has to do with it. This is the third...
Curated OER
Review of Ionic and Covalent Compounds and Transitioning from Ionic to Covalent Compounds
Here is a unique assigment: compare and contrast ionic and covalent compounds in an extensive data table and then analyze Lewis dot structures in antoher. Three columns are to befilled in: "characteristic or feature," "applies to ionic...
Curated OER
Round and Round
Learners interpret data from a three-dimensional array of current monitors to determine an overall pattern of water circulation. They hypothesize what effect an observed water circulation pattern might have on seamount fauna. A very...
Curated OER
Graphing and Analysis of Water Quality Reports
Students practice making graphs and interpreting them. They compare and contrast different sets of data. They use Microsoft Excel to create different types of graphs.
Other popular searches
- Aquifer Water Table
- Water Table Diagram
- Water Table and Recycling
- Water Table Erosion Sand
- Sand and Water Tables
- Making a Water Table
- Science Water Table
- Soil and Water Table
- Water Table Activities
- Location of Water Table
- The Water Table


