Missouri Department of Elementary
The Hope to Cope: Coping Skills
Making decisions can be stressful, even for sixth graders. And even students this young have developed coping skills, some positive and some negative, to help them deal with stress. Class members are asked to identify several of their...
Curated OER
Organizing Data Using Tables and Graphs
Young scholars create graphs and tables, as well as interpret and make inferences from the data shown to determine when and where graphs and tables are most useful.
Curated OER
Data Display
Learners explore different ways to display data. In this statistics lesson, students create pie charts, bar graphs and line graphs to show data. Learners then write a paragraph discussing which types of graphs are helpful for different...
NASA
MASS, MASS – Who Has the MASS? Analyzing Tiny Samples
What is it worth to you? A hands-on lesson plan asks groups to collect weights of different combinations of coins and calculate weighted averages. They use the analysis to understand the concept of an isotope to finish the third lesson...
Missouri Department of Elementary
To Give In or Not to Give In—That Is the Question!
No! A very simple word that can be very hard to say. Seventh graders have an opportunity to practice this difficult skill as they engage in a series of role-playing scenarios. As an exit ticket, 7th graders write a reflection on the...
Curated OER
Maps and Modes, Finding a Mean Home on the Range
Fifth graders investigate data from maps to solve problems. In this data lesson, 5th graders study maps and collect data from each map. Students present their data in a variety of ways and calculate the mode, mean, median, and range.
101 Questions
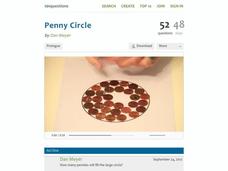
Penny Circle
Watch as your classes buy into a rich lesson full of information. A video opener challenges individuals to determine the number of pennies that fit in a circle with a 22-inch diameter. Using lesson materials, scholars collect data and...
Museum of Tolerance
Why is This True?
Are wages based on race? On gender? Class members research wages for workers according to race and gender, create graphs and charts of their data, and compute differences by percentages. They then share their findings with adults and...
Curated OER
Technobiz
Students examine candy preferences to create a plan in order to improve candy sales. In this technobiz lesson, students build spreadsheet and organizational skills by graphing and calculating data. Students are introduced to terminology...
Florida Department of Health
Mental and Emotional Health Education Unit
Stressed out? To begin a mental and emotional health unit, participants take a stress test to determine their level of stress. They study the effects of stress, identify sources of stress in their lives, and learn different ways to...
Museum of Tolerance
Where Do Our Families Come From?
After a grand conversation about immigration to the United States, scholars interview a family member to learn about their journey to America. They then take their new-found knowledge and apply their findings to tracking their family...
Curated OER
Trash to Gas
Students experiment with biomass materials as alternative energy sources. In this biomass material lesson, students participate in an experiment with cow manure to determine how it can be used as an energy source. They record their data...
Curated OER
Making and Interpreting Tables
In this data tables worksheet, students make and interpret data tables given data about magazine sales. They categorize their data, complete their data table and answer questions about their data.
Pennsylvania Department of Education
Freckle Face
Students collect and record data. In this early data analysis lesson plan, students gather data about their partners face. As a class, the students use tally marks and pictographs to record the data and answer question about the...
Curated OER
Using a Database to Organize Vocabulary Words
Students use a database as a vocabulary resource during writing/reading. They preview stories and list unknown works into their reading notebooks. Students find the definitions, and enter their words into a database using a teacher...
Laboratory for Atmospheric and Space Physics
The Planets and Scale
Scholars gain an insight into the relative size of planets and distance between inner and outer planets with the help of informational text, a data table, and a series of four questions.
Curated OER
Capturing and Sharing Language Acquisition
Practice language development and linguistics with a lesson featuring audio recordings. As kids record the ways they pronounce words and sentences, they learn to upload and organize their audio files into iTunes.
Curated OER
Where Do I Fit on the Graph?
Students collect data and create graphs about themselves, their community, and the world around them. They use a variety of methods to organize data, such as stickers, clothespins, name tags, coloring, tally marks, etc.
Alabama Learning Exchange
Poppin' For Popcorn!
Students graph data from different popcorn flavors. In this graphing lesson, students make graphs using an assigned web site after collecting data about the flavors of popcorn that fellow classmates prefer.
Teach Engineering
Lighting in My Classroom Survey
How much energy does it take to light a room? Class members calculate the total wattage it takes to light the classroom. Through calculations, responsible scientists determine the cost of energy for the year, then figure out how much...
Scholastic
Study Jams! Double-Line Graphs
With two summers of babysitting money, Mia needs a way to compare her earning from both years. Show your learners that they can organize the data onto a double-line graph to easily compare which summer was more profitable. The lesson...
Curated OER
Mathematics Witing: Algebraic Processes and Its Connections to Geometry
Students, using manipulatives, determine how many different ways there are to arrange 3 and 4 objects. They organize and record their arrangements. Students investigate the pattern generated by 3 and 4 objects, they predict how many ways...
Curated OER
Handling Data- Health Statistics
In this social studies worksheet, students organize 50 country cards into groups. Students analyze a chart and group countries according to lowest, middle, and highest Infant Mortality Rate.
Curated OER
WHAT IS THE POPULAR COLOR?
Fourth graders graph cars according to their colors. They complete the graph including a title, scale, x-axis, and y-axis. Students collect the data and choose the type of graph to be made.


