Curated OER
Fast Food Survey Using Bar Graphs
Second graders create a bar graph to pictorically represent the data collected from a survey of students. They use Excel to electronically create the graphs and data tallies. They then interpret their data using sentences to explain.
Curated OER
Linear and Exponential Models
High schoolers investigate the differences between linear and exponential models. In this linear and exponential models activity, students make a table of given data. High schoolers determine if the data is linear or...
Curated OER
Straw Breathing Exercise
Students fill out an anonymous questionaire to explore whether they might have asthma. They then set up a spreadsheet to enter the data, decide on a definition of asthma, and figure out the prevalence of asthma. Pupils simulate what it...
Curated OER
Who's got the fastest legs?
Students use a stopwatch to collect information for a scatterplot. In this fastest legs lessons, students collect data through the taking of measurements, create and find a median number. Students develop an equation and...
Curated OER
What's the Point?
Students learn why the census makes a difference. In this U.S. Census lesson plan, students identify who uses census data and how, trace the impact of census data from Census 2000, and present findings in a graphic format.
Curated OER
Political Parties and Election Results, 1997 and 2000
Students become familiar with the results of the Canadian Federal Election by analyzing data on the number of valid votes by political affiliation. In this civics lesson plan, students integrate data and knowledge with other research...
Curated OER
Quick Stats with Quick Poll
Learners analyze data using bar graphs and the TI in this statistics lesson. They investigate quick polls and graph the data using different properties of statistics. This assignment requires a TI Navigator.
Curated OER
Global Statistics
Students determine statistics based on data. In this statistics lesson, students use data and record in charts. Students create graphs based on the statistics found.
Curated OER
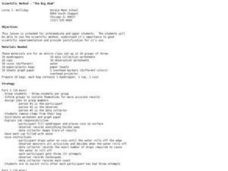
Scientific Method- "The Big Ahah"
Students experiment with water, dropper and a coin to study the scientific method. In this scientific method lesson plan, students are in groups, each with a coin, water and a dropper. They investigate how many drops of water can fit on...
Curated OER
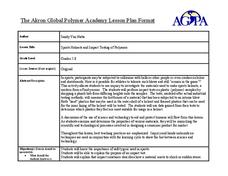
Sports Helmets and Impact Testing of Polymers
Learners examine the importance of good quality safety gear. In this investigative activity, students will tests various polymers, collect data, and analyze the data to determine which polymer is best for safety helmets. They will design...
Curated OER
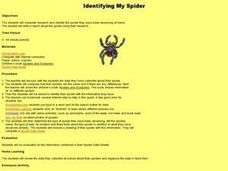
Identifying My Spider
Third graders navigate the Internet and research spiders. In this spider lesson, 3rd graders view photos of spiders and use their characteristics to determine the variety of spider. Students complete a spider data sheet.
Curated OER
Box-and-Whisker Plots
Eighth graders measure in feet and inches and convert to explore the relationship between the converted measurements. In this measurement lesson, 8th graders use the whisker and box plot to represent the measurement of a cat. ...
Curated OER
World Population Activity II: Excel
Students import UNEP World population data/projections from either the World Population Prospects: The 2002 Revision Population Database - UN Population Division or a text file. They graph this data by itself, and then along with...
Curated OER
Mapping The Ocean Floor
Young scholars explore and analyze the bottom structure of underwater habitats. They describe and explain what can't see through the collection and correlation of accurate data. Learners assess that technology is utilized as a tool for...
Curated OER
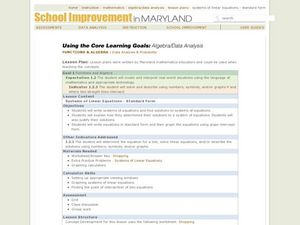
Functions & Algebra
Students examine linear equations. In this functions and algebra lesson, students write equations in the slope-intercept form. They enter data in a graphing calculator, examine tables, and write linear equations to match the data.
Curated OER
Weight and Velocity
Middle schoolers perform an experiment in order to determine how increasing weight affects the velocity of a truck and use the computer to compile their data.


