Math Mammoth
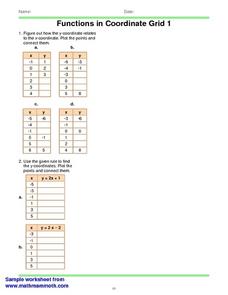
Functions in Coordinate Grid 1
In this math worksheet, students are given 4 tables of x-y coordinates and a grid. Students figure the relationship between the x and y coordinate and plot the points. Students then use a given rule to find the y coordinate.
Curated OER
Lessen the Loan
Middle-schoolers explore the concept linear equations. They use the internet to navigate through videos and problems. Pupils problem solve to determine rates of change, slope, and x and y-intercepts.
Curated OER
Walking the Plank
This is a cool math activity. Kids collect and interpret data based on a physical act. A board is balanced between a scale and a step, learners record a peer's weight as it decreases while s/he walks further away from the scale. They...
Film English
Missing U
Explore the relationship between U and I with a video and related activities. First, pupils have some fun with the alphabet and discuss text message language. Next they practice coming up with words that have the same sound a I and U....
Curated OER
Rounding and Subtracting
Common Core is all about getting your learners to open their minds and think about the why and how. This problem has them thinking about unknown numbers and their relationship with one another when we round and subtract. They will have...
Illustrative Mathematics
Exponentials and Logarithms II
Learners are given a logarithmic function and its inverse exponential function. The task, which is to graph both compositions of the two functions, uses the inverse nature of exponents and logarithms to generalize about the properties of...
Willow Tree
Slope
Investigate the different types of slope using graphs and ordered pairs. Scholars use the slope formula to determine the slope of a line between two points. Includes examples with a slope of zero and with no slope. The instructional...
Willow Tree
Approximating a Line of Best Fit
You may be able to see patterns visually, but mathematics quantifies them. Here learners find correlation in scatterplots and write equations to represent that relationship. They fit a line to the data, find two points on the line, and...
Shodor Education Foundation
Two Variable Function Pump
Use a function to operate on two variables. Pupils look at operating with complex numbers as a function of two variables. The interactive squares the input and adds a constant to it. Learners visualize the resulting output and its...
Curated OER
The Slope of a Line
In this slope instructional activity, students examine graph and determine the slope of a line. They determine coordinates of a point to make a true statement. Students identify the dependent variable and the independent variable. ...
Willow Tree
Direct and Inverse Variations
Enhance pupil understanding of proportions and variable relationships by studying direct and inverse variation. Use the idea of a proportional relationship to teach direct variation. Then use a similar pattern to help individuals...
West Contra Costa Unified School District
Discovering Slope of a Line in Standard Form
From start to finish this skills practice resource provides a way for individuals to explore the standard form equation of a line. Begin with a warm-up, work through the problems, and then discover the relationship between the equation...
Virginia Department of Education
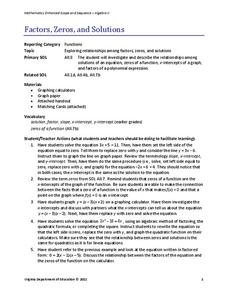
Factors, Zeros, and Solutions
Factors, zeros, and solutions, oh my! Don't let your classes become overwhelmed with the vocabulary. An engaging lesson helps learners make a connection between factors, zeros, and solutions. Pupils explore the relationship between the...
Curated OER
Proportions
In this proportions worksheet, students solve and complete 7 various types of problems. First, they determine the better buy based on the information provided for each word problem. Then, students find the value of a variable given its...
Saxon
Plotting Functions
Youngsters use a graphing calculator to assist in creating a function table. They graph the function on a coordinate plane. They explore the relationship between the domain and range in the graph. This four-page worksheet contains two...
Inside Mathematics
Squares and Circles
It's all about lines when going around. Pupils graph the relationship between the length of a side of a square and its perimeter. Class members explain the origin in context of the side length and perimeter. They compare the graph to the...
Curated OER
Coordinate Planes
Identifying the location of ordered pairs on coordinate planes is the focus in the math instructional activity presented here. In it, 4th graders are introduced to coordinate pairs, the x/y axis, and the techniques associated with this...
Illustrative Mathematics
Peaches and Plums
According to the resource graph, which costs more: peaches or plums? Algebra learners compare two proportional relationships and then throw in a banana. Leaving out the scale helps students become intuitive about graphing.
Curated OER
Logarithmic Functions
Learners explore the characteristics of logarithmic functions and their relationship to exponential functions. Using the subscriber website Explorelearning.com, pupils observe changes in the input variable and its effect on the graph of...
Virginia Department of Education
Functions 2
Demonstrate linear and quadratic functions through contextual modeling. Young mathematicians explore both types of functions by analyzing their key features. They then relate these key features to the contextual relationship the function...
Curated OER
Profitable Soda Stand
Am I making any money? Help learners determine if their fictitious soda stand is turning a profit. They graph linear equations using the slope and y-intercept and identify the best price to use to sell soda. They identify the domain and...
Noyce Foundation
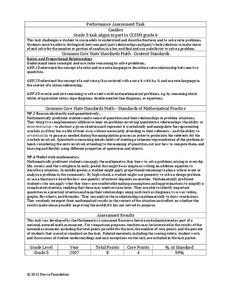
Candy Fractions
While examining fractions and ratios, your leaners get to read about one of their favorite subjects: candy! There are four word problems on this worksheet. Learners consider situations in which "for every x caramels there are y...
Curated OER
When Will We Ever Use This? Predicting Using Graphs
Here are a set of graphing lessons that have a real-world business focus. Math skills include creating a scatter plot or line graph, fitting a line to a scatter plot, and making predictions. These lessons are aimed at an algebra 1 level...
Curated OER
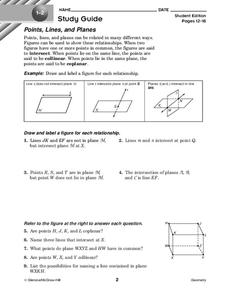
Points, Lines, and Planes
In this points, lines, and planes worksheet, 10th graders solve 9 various problems related to determining points, lines, and planes. First, they define intersect, collinear, and coplanar of one or more points. Then, students draw and...


