Curated OER
Slope Y-intercept Quiz
In this algebra worksheet, students identify the slopes and y intercept of a line. They complete the quiz,by graphing and identify linear equations. There are 6 questions with an answer key.
Curated OER
Writing Linear Equations in Slope-Intercept Form
In this math worksheet, students are given three lines graphed on a coordinate grid. Students identify the slope, intercepts, and write an equation for each. Students find the intercepts of a linear equation, and graph them. They write...
Curated OER
Graphing Linear Equations
In this graphing linear equations learning exercise, 9th graders solve and graph 6 different problems that include various linear equations. First, they graph each equation using the x- and y-intercepts of each. Then, students graph each...
Curated OER
Graphs of Quadratic Functions Section 11.6
In this graphing worksheet, learners graph quadratic functions. They identify the maximum and minimum value of the function, determine the line of symmetry, and locate the vertex. Coordinate planes are provided for each function. There...
Curated OER
Graphing a Rational Function
For this graphing rational functions worksheet, students find the domain, asymptotes, intercepts and graph a given rational function. A grid for the graph is provided.
Alabama Learning Exchange
We Love to Graph!
Students experience graphing points. In this graphing points lesson, students play an on-line game where they must name 10 coordinate pairs correctly. Students play a maze game where they maneuver a robot using coordinate...
Concord Consortium
Function Project
What if a coordinate plane becomes a slope-intercept plane? What does the graph of a linear function look like? Learners explore these questions by graphing the y-intercept of a linear equation as a function of its slope. The result is a...
Illustrative Mathematics
Find the Change
This exercise is an opportunity for algebra learners to understand the connection between the slope of a line and points found on the line. Use similar triangles to explain why slope m is the same between any two points. Discuss with the...
Illustrative Mathematics
Graphs of Quadratic Functions
The equations look different, but their graphs are the same. How can that be? This activity leads your mathematicians in an exploration of three different forms of the same quadratic function. After comparing the equations, their graphs,...
Curated OER
Hybrid Vehicles: Cut Pollution and Save Money
Math and science meet in this lesson on hybrid electric automobiles. This 24-page resource provides everything you need for teaching a lesson that compares the use of internal combustion engines to hybrid electric engines. Participants...
Curated OER
Exploring Slope
For this exploring slope worksheet, students solve and complete 4 different problems. First, they compare an object's weight on Earth to an object's weight on another planet using the information given. Then, students compare this...
CPALMS
Writing an Exponential Function from its Graph
Grow an equation for the exponential graph. Given a graph of an exponential function, class members write the equation of the function provided. The graph labels two points on the graph: the y-intercept and the point where x is one.
Curated OER
Linear Equations
In this Algebra I worksheet, 8th graders write the equation of a line given two points and given a linear equation determine the slope, x-intercept, y-intercept, and graph the line. The five page worksheet contains ten...
Curated OER
Linear Equations
In this Algebra I worksheet, students determine the graph of the equation of a line. Students determine the x- and y-intercepts and graph. The three page worksheet contains six problems. Answers are not...
Curated OER
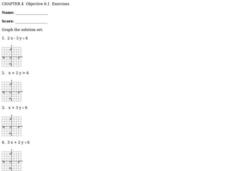
Graphing Inequalities
In this graphing inequalities activity, students solve and graph the solution set for eight inequalities. They first solve each inequality, either for x or for y, then they plot the coordinates found on the graph provided for each...
Curated OER
Coordinate Geometry
In this Algebra I activity, 9th graders identify and graph points on a coordinate plane, determine the x-and y-intercepts of a linear equation, and graph linear equations. The six page activity contains nineteen problems. ...
Curated OER
Functions and Relations
In this functions and relations instructional activity, 11th graders solve and complete 15 various types of problems. First, they find the slope and y-intercept for each function given. Then, students find the slope of the line passing...
Curated OER
Final Exam Review: College Algebra
In this final exam review activity,s learners solve systems of equations, polynomials and factor quadratic equations. They identify the slope of a line and write linear equations. Students use Cramer's rule, graphing,...
Curated OER
The Slope of a Line
In this slope instructional activity, students examine graph and determine the slope of a line. They determine coordinates of a point to make a true statement. Students identify the dependent variable and the independent...
Curated OER
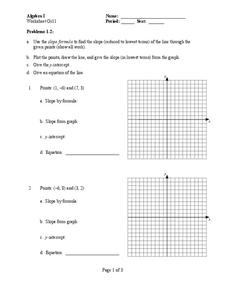
Algebra I - Worksheet G12: Graphing Lines
In this graphing lines worksheet, learners graph 28 lines given various data. Students graph lines given two points, a point and slope, and a line perpendicular or parallel to a point.
West Contra Costa Unified School District
Graphing Systems
Get hands on with solving systems of equations graphically. A solid lesson plan uses guided practice to show how to solve systems of linear equations. It allows time for sharing ideas and provides a printable matching activity...
Mt. San Antonio Collage
Test 1: Functions and Their Graphs
Save the time creating an assessment because these function problems should do the trick. With 10 multi-part questions, they each focus on a different topic including radical, polynomial, linear and piecewise functions. The majority of...
Curated OER
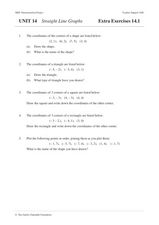
Straight Line Graphs
In this math worksheet, students plot lines on a graph paper when given the equation for the line in slope-intercept form. They tell the values of the slope and the y-intercept. Students find the x and y intercepts and plot three lines....
Curated OER
Additional Practice Problems with Skills for Quadratic Functions and Equations
Challenge your students' graphing and factoring skills with these sets of problems for quadratic functions and equations. Here, students plot the y-intercept and vertex of 7 parabolas. They factor and solve 9 quadratic equations....


