Curated OER
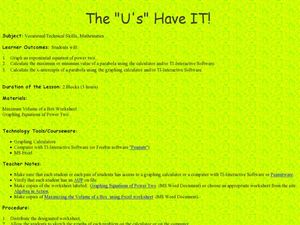
The "U's" Have IT!
Students explore the maximum and minimum values of parabola. In this exponential equations instructional activity, students use graphing calculators or TI Interactive Software to calculate values of parabola and graph x-intercepts of...
Curated OER
Graphing Lines & Finding Intercepts 1
In this graphing lines worksheet, students examine given linear equations. They graph each linear equation, and identify the x and y-intercept of each problem. Students create six graphs of given equations.
Curated OER
Analyzing Equations Through Slope and Y-int
With problems applying to modern-day topics like Netflix and McDonald's, math whizzes analyze graphs and investigate the slopes. In this algebra worksheet, learners identify the slope and y-intercept of the given equations. They graph...
Curated OER
Y-Intercept and Slope Intercept Form
Alegebra amateurs identify the slope and the y-intercept given a linear equation in slope-intercept form by correctly completing some in class problems. They write the linear equation in slope-intercept form that corresponds to the given...
Illustrative Mathematics
Find the Change
This exercise is an opportunity for algebra learners to understand the connection between the slope of a line and points found on the line. Use similar triangles to explain why slope m is the same between any two points. Discuss with the...
Curated OER
An Introduction to Polynomial Functions
In this introduction to polynomial function worksheet, young scholars classify, state the degree, find the intercepts, and evaluate polynomial functions. Six of the problems are true/false problems and thirty-eight and free-response...
Curated OER
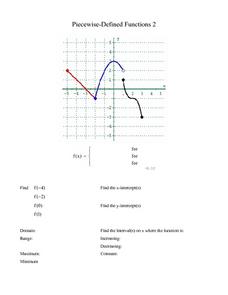
Piecewise-Defined Functions 2
In this Piecewise-Defined function worksheet, 10th graders identify the function for a given graph. Additionally, they find the y-intercept, y-intercept, domain, range and interval of each function. Students solve this information for...
Curated OER
Piecewise-Defined Functions 1
In this piecewise-defined function, students explore the graph of given functions and match it to the proper equation. They identify the x and y-intercepts, domain, range, and interval of each function. There are approximately ten...
EngageNY
The Line Joining Two Distinct Points of the Graph y=mx+b Has Slope m
Investigate the relationship between the slope-intercept form and the slope of the graph. The lesson plan leads an investigation of the slope-intercept equation of a line and its slope. Pupils realize the slope is the same as the...
Curated OER
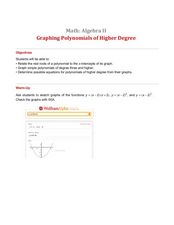
Graphing Polynomials of Higher Degree
Using Wolframalpha graphing capabilites, algebra learners graph polynomials with degrees of three and larger. They identify the roots and graph each polynomial, predict zeros and shapes of graphs, and validate their understanding through...
Curated OER
Introducing y = mx + b
Middle and high schoolers use the slope intercept form to graph a line. In this algebra lesson, pupils rewrite equations from standard form to y-intercept form. They use the slope and y-intercept to graph a line without making a table of...
Curated OER
More Graphing With Intercepts
For this graphing worksheet, young scholars graph linear equations. They identify the x or y-intercept. Coordinate planes are available below each equation. Nine problems are provided on this two-page worksheet.
Curated OER
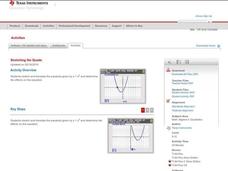
Stretching the Quads
Explore parabolas in this algebra lesson with the graphing calculator. The class investigates what effects the changing of the parameters of the vertex form of a quadrati have to its graph. They find the zeros of a quadratic graphically...
Curated OER
Hybrid Vehicles: Cut Pollution and Save Money
Math and science meet in this lesson on hybrid electric automobiles. This 24-page resource provides everything you need for teaching a lesson that compares the use of internal combustion engines to hybrid electric engines. Participants...
Curated OER
Standard Linear Form
Ninth graders identify and describe the x-intercept as the place where the line crosses the x-axis as it applies to football. They create their own differentiations to reinforce the distinction between the x-intercept and the...
Curated OER
Point-Slope Form
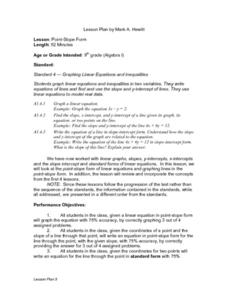
Ninth graders explore the point-slope form of linear equations and graph lines in the point-slope form. After completing the point-slope equation, they identify the slope of a line through a particular point. Students explain the...
Curated OER
Slope, Intercepts, and Graphing a Line
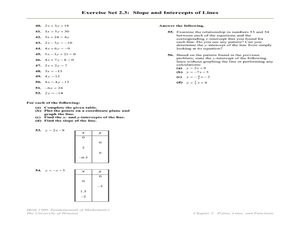
In this intercepts and slope worksheet, students find the slope and/or the x and y-intercepts in fifty-three problems. Students also graph lines using the x and y-intercepts.
Willow Tree
Graphing
So many methods and so little time! The efficient method of graphing a linear equation depends on what information the problem gives. Pupils learn three different methods of graphing linear equations. They graph equations using...
Curated OER
Writing Linear Equations in Slope-Intercept Form
In this math worksheet, students are given three lines graphed on a coordinate grid. Students identify the slope, intercepts, and write an equation for each. Students find the intercepts of a linear equation, and graph them. They write...
Willow Tree
Linear Relationships
There's just something special about lines in algebra. Introduce your classes to linear equations by analyzing the linear relationship. Young mathematicians use input/output pairs to determine the slope and the slope-intercept formula to...
Illustrative Mathematics
DVD Profits, Variation 1
The idea in the resource is to understand the connections between proportional relationships, lines, and linear equations. To stay within the context of the standard, skip the part of the resource that solves with unit rates. Instead,...
Curated OER
Graphing Rational Functions
Learners complete an activity, included, of the information on asymptotes and intercepts. They also solve and complete eight questions on graphing rational functions, file included. Finally, pupils summarize vertical asymptotes,...
Curated OER
Equal Differences Over Equal Intervals 2
Your algebra learners explore linear functions concretely using tables of values in a collaborative task. The idea that linear function values change by equal differences over equal intervals, is emphasized. The slope and y-intercept...
Curated OER
More On Graphing Linear Equations
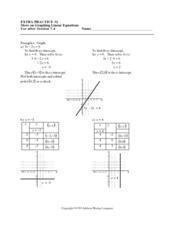
In this linear equation worksheet, students graph linear equations and identify the x or y-intercept. There are nine graphing equations on this two-page worksheet.
Other popular searches
- X and Y Intercepts
- Finding X and Y Intercepts
- X and Y Intercepts
- X & Y Intercepts
- X and Y Intercepts
- Graph Using X and Y Intercepts
- Finding the X and Y Intercepts
- X Y Intercepts Graphing
- X Y Intercepts
- Graph X and Y Intercepts
- Graphing X and Y Intercepts
- X and Y Intercepts


