Curated OER
IMAGE Satellite and Solar Cells
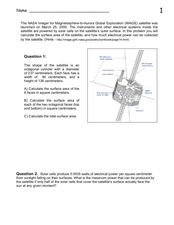
In this IMAGE satellite and solar cells worksheet, students calculate the surface area of the satellite in order to determine how much electrical power can be generated by the solar cells.
Curated OER
IBEX Creates an Unusual Image of the Sky!
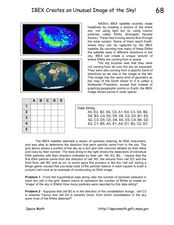
In this IBEX satellite worksheet, students read about the Energetic Neutral Atoms that are detected by the IBEX satellite. Students use a given hypothetical data string to determine the number of particles detected and create an 'image'...
Curated OER
Keep In Touch: Communications and Satellites
Fourth graders explore communications by reading assigned space science text. In this satellite instructional activity, 4th graders identify the concept of orbiting and examine gravitational pull by viewing diagrams. Students are...
Curated OER
LRO's First Image of Mare Nubium
In this scale image worksheet, learners use an image taken by the LRO satellite of Mare Nubium to determine the scale of the image, the diameter of the smallest crater and a comparison scale drawing of a house.
Curated OER
Geography from Space
Students explore geography as seen from space. In this web-based lesson, students brush up on geography skills by identifying geographic locations based on satellite or aerial images and a brief clue.
NASA
Observing Monsoon Weather Patterns with TRMM Data
Follow a fabulous slide show on how monsoons form and how satellite technology is being used to observe the phenomena, explaining why they occur. Afterward, visit the TRMM (Tropical Rainfall Measuring Mission) website to access actual...
PBS
Passion for Pixels
Picture this: a fun activity for pupils to discover pixels. After learning about digital signals and pixels, scholars act as senders and receivers of an image. The sender indicates zero or one to tell whether each square in a grid is...
Curated OER
From Pirates to Pilots to Spies
Sixth graders enjoy this introduction to the world of map projections, globes, aerial photographs, and satellite images. This lesson instructs students on the advantages and disadvantages of each earthly representation.
Curated OER
Interpreting Aerial Photographs
Students interpret aerial photographs. They view aerial photographs or satellite-produced images to locate and identify physical and human features. They study satellite images and label their images for bodies of water, clouds,...
Curated OER
This Dynamic Earth: The Story of Plate Tectonics
Discuss Earth's tectonic plates at middle school level with an informative presentation. Packed with maps, satellite images, diagrams, and photographs, the slideshow connects with any curriculum focused on plate tectonics. It...
Curated OER
Using Vegetation, Precipitation, and Surface Temperature to Study Climate Zones
Using NASA's Live Access Server, earth scientists compare the temperature, precipitation, and normalized difference vegetation index for four different locations. They use the data to identify the climate zone of each location using...
Curated OER
Exploring a City from Space
For this exploring cities from space worksheet, students use a satellite image from the QuickBird Satellite to determine the image scale. They use the image scale to calculate the length of the Bellagio Hotel in Las Vegas, the length of...
Curated OER
You Can Die Here – Death Valley California
Young scholars use Google Maps to explore the rain shadow desert. In this climate lesson, students use the Internet, Google Maps, and directed inquiry worksheets to understand how rain shadow deserts form. Young scholars apply climate...
Curated OER
How Wet Did It Get?
Students measure the rainfall/snowfall on the playground on a rainy/snowy day with a rain/snow gauge. They draw a bar graph representing the amount of water that fell and observe a satellite image of the clouds and local weather system...
Curated OER
Sequencing From Close To Far
Students explore how objects stay the same size and only "look" like they change when closer are farther from the object. They sequence aerial photos and satellite images from closest to farthest.
Curated OER
Satellite Eyes
Students explore the ways in which satellite images provide details of the Earth's surface and how they are capable of taking digital images of the Earth from space they vary in resolution and breadth. They view how cameras and lenses...
Curated OER
Hinode Studies Loopy Sunspots!
In this sunspots and magnetic fields instructional activity, students read about the satellite images taken showing 'loopy' patterns from solar gases and the magnetic fields on the sun. Students solve 2 problems including finding the...
Curated OER
Forest Fires
Students play the role of a Ranger with the Department of Forestry. In this forest fires instructional activity, students examine data on biomes and images to determine high risk areas for forest fires to develop.
Curated OER
Changing Planet: Melting Glaciers
Resource links to a video, satellite images, data, and photographs of glaciers provide emerging earth scientists the opportunity to examine how the ice has been retreating over the years. A data table is included for pupils to record...
Curated OER
Plate Tectonics - Evolution of the Earth
Tons of photographs, diagrams, animations, and satellite images fill the slides of an education earth science presentation. It begins with volcanic activity and earthquakes, and then moves into plate tectonics, boundaries, and driving...
PBS
Coastline Change
Continental drift happens over millions of years, but new perspective shows much faster changes. An informative resource offers a short term perspective using a series of satellite images. Viewers observe major changes to a coastline in...
PBS
Rain Shadows
Satellite images from NASA help scholars focus on the similarities on the planet rather than the differences. The photos from the installment of a larger PBS series exploring weather and climate compare geological formations in the...
PBS
Regional Patterns of Climate: Pacific Northwest
Climate systems involve sunlight, ocean, atmosphere, ice, land forms, and many other factors. Scholars explore each of these variables related to the Pacific Northwest rain forest. They use an online interactive to investigate the polar...
Curated OER
Remote Sensing - What Can We See When We Can't Touch?
Students discover how remote sensing is used to identify the signatures of life even when the particular life form is not directly observable. They investigate how a satellite "sees" objects on the surface of Earth.
Other popular searches
- Satellite Imagery
- Hurricane Satellite Images
- Infrared Satellite Imagery
- Image Satellite
- Aerial and Satellite Imagery
- Satellite Images of Erosion
- Science Satellite Imagery
- Satellite Imagery Weather Maps
- Octagonal Image Satellite


