Curated OER
Simple Bar Graphs Using Excel
Middle schoolers create original survey questions, and develop a bar graph of the data on paper. They input the survey data using two variables onto an Excel bar graph spreadsheet.
University of Missouri
Money Math
Young mathematicians put their skills to the test in the real world during this four-lesson consumer math unit. Whether they are learning how compound interest can make them millionaires, calculating the cost of remodeling their bedroom,...
Curated OER
Global Economy: A Simple Activity
Students explore the global economy. In this economics instructional activity, students examine clothing labels in search of the countries the clothing was made in. Students consider the implications of a global economy.
University of Georgia
Endothermic and Exothermic Reactions
Equip your chemistry class with the tools to properly understand endothermic and exothermic reactions. Young chemists collect, analyze, and graph data to determine how the Law of Conservation of Matter is applied to chemical composition...
National Security Agency
It's Probably Probable
Learners make predictions and draw conclusions from given information as they learn the meaning of probability in this vocabulary-rich, integrated activity that presents a variety of teaching strategies to motivate and reach all learning...
Physics Classroom
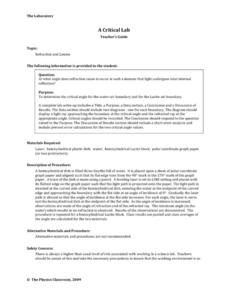
A Critical Lab
Physics lab groups finagle with laser lights to determine the critical angle of refraction for both water and Lucite. Because there are no detailed steps or an answer key for this enlightening exercise, an inexperienced physics...
Midnight Martian
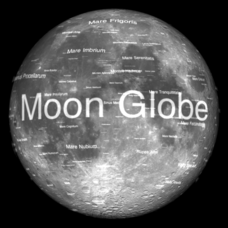
Moon Globe
Not just a simple globe of the moon, this interactive version allows you to choose lighting according to the location of the sun, views from different positions on Earth, and more! Satellite images and topographic data have been combined...
Teach Engineering
Searching for Bigfoot and Others Like Him
Individuals create a GIS data layer in Google Earth that displays information about where one might find seven different cryptids. The class members research to find data on cryptid sightings they can include in their data layer.
Curated OER
Party, Party, Party
Second graders conduct investigations with counting, comparing, organizing, analyzing, displaying and interpreting data. They pose questions for investigation and collect the data. Students display the data in tally charts, uniform...
Illustrative Mathematics
Puzzle Times
Give your mathematicians this set of data and have them create a dot plot, then find mean and median. They are asked to question the values of the mean and median and decide why they are not equal. Have learners write their answers or...
Curated OER
I'm a Weather Watcher Watching plants grow by......my,my,my
Students investigate how weather affects how plants grow. They collect data on weather and plant growth for a week and display the data on a graph. For a culminating experience they design a movie using software that shows plant growth...
Curated OER
Hopes and Dreams: A Spreadsheet Lesson Using Excel
Fourth graders read "The Far Away Drawer" by Harriet Diller and discuss the story as a class. After discussion, 4th graders create a t-shirt GLYPH about their hopes and dreams,share their information with the class and create spreadsheets.
University of North Carolina
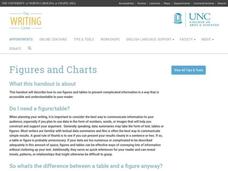
Figures and Charts
Sometimes words aren't the best way to get information across to the reader. The eighth handout in the 24-part Writing the Paper series describes different type of figures and charts to display complex information in a paper....
Beauty and Joy of Computing
Nesting Lists
Create lists within lists. The second lab in a series of five in the unit has pupils develop a simple contact list app. The tasks within the lab build the need for an abstract data type. Individuals build more complexity into their...
02 x 02 Worksheets
Inverse Variation
Discover an inverse variation pattern. A simple lesson plan design allows learners to explore a nonlinear pattern. Scholars analyze a distance, speed, and time relationship through tables and graphs. Eventually, they write an equation to...
Curated OER
Jellybean Graphs
Second graders predict and graph data based on the color of jelly beans they think are in a handful. In this prediction lesson plan, 2nd graders will predict how many of each color jellybean are in a handful. Then they graph these...
Curated OER
Probability and Applications of Simulations
Middle schoolers apply properties of probability to the real world. In this probability lesson, learners simulate the construction of empirical distribution. They collect and analyze data using central tendencies.
Curated OER
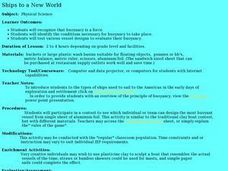
Ships to a New World
Students experiment with buoyancy as a force. In this buoyancy lesson plan, students access an assigned website to examine the sailing vessels that came to the New World. They work as teams to build boats out of aluminum foil to see...
Curated OER
Sink/Float Discovery bottle
Investigate which items float and which ones sink using this resource. Learners participate in an activity in which they investigate this phenomena. Then they describe the experimental process, and learn how to display their results.
Curated OER
Lesson 4 Activity 1: Mapping the Third Dimension
Students work in pairs to construct a simple stereoscope.
Curated OER
Invasives and Macroinvertebrates
Students view macroinvertebrates, or discuss previous collection activity. They graph data on macroinvertebrates in the Hudson River. Students discuss the relationship between habitat, environmental changes, and invertebrate diversity or...
Curated OER
Science Fair With An Energy Efficiency Flair
In order to learn more about energy conservation, pupils work to promote energy efficiency by participating in a school-wide science fair with an emphasis on energy conservation. In addition to displaying their projects, learners invite...
Curated OER
What Are You Eating?
Discover the calorie content of foods by observing how much heat they produce in water. If you have a calculator-based laboratory (CBL™) insturment for collecting data, then this laboratory worksheet will not need any changes. If not,...
Alabama Learning Exchange
Bear Factory Probability
By examining a set of dice roll data, statisticians determine the probability of different sums occurring. They visit an interactive website and determine how many different vacation outfits Bobbie Bear will have based on the colored...


