CK-12 Foundation
Understand and Create Line Graphs: Line Graphs
Explore line graphs and their characteristics through an interactive lesson. Scholars follow a set of directions to plot data on a line graph. They then answer questions about the type of variables, minimum and maximum values, and...
CK-12 Foundation
Line Graphs to Display Data Over Time: Strawberry Competition
Take the tediousness out of graphing. Using the interactive tool, learners can efficiently create a line graph from a set of data. They then use the graph to answer questions about specific trends in the data.
Curated OER
Bar Graphs and Line Graphs
In this bar graphs and line graphs worksheet, students examine given data, organize it, and create bar graphs and line graphs from the given information. They interpret graphs and write statements explaining the graph. This one page...
CK-12 Foundation
Broken-Line Graphs: Heating Curve of Water
Examine the unique graphs coined broken-line graphs. Using the phase change of water for data, learners answer questions related to the temperature and energy at different times in the cycle of the phase change. Questions focus on the...
Common Core Sheets
Determining Coordinates: Graphing Patterns
Building on their prior knowledge about patterns, this series of worksheets introduces young mathematicians to graphing in the coordinate plane. Using written descriptions of different numerical patterns, learners...
CK-12 Foundation
Multiple Line Graphs: Jack's Jumpshot
What are the advantages to seeing multiple data sets on the same graph? Scholars explore this question as they manipulate the animation within the lesson. Questions within the interactive ask individuals to make comparisons across the...
Curated OER
Line Graphs
In this line graphs worksheet, 8th graders solve and complete 20 different problems that include reading various line graphs. First, they use the information provided in each line graph to determine the correct response to each of the...
Balanced Assessment
Dollar Line
Challenge the class to develop a story that matches a graph. The short assessment provides a line graph with the vertical axis labeled as dollars. The task asks pupils to develop a description of a situation that could be represented by...
Mathed Up!
Straight Line Graphs
Develop graphs by following the pattern. The resource provides opportunities for reviewing graphing linear equations. Pupils create tables to graph linear equations by using patterns whenever possible. The worksheet and video are part of...
Curated OER
Line Graphs
In this line graphs instructional activity, 8th graders solve and complete 10 different problems that include various line graphs. First, they use each line graph shown to respond to the questions that follow regarding books and...
Curated OER
Graphing Toys!
Jason, Michelle, Sofia, and Willis all have a variety of toys. Use the chart provided to graph how many toys each child has. Who has the most toys? Who has the least? Help your learners study the graphs they create to better understand...
Curated OER
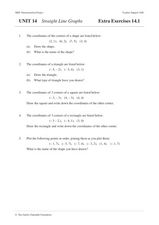
Straight Line Graphs
In this algebra worksheet, students graph coordinate pairs on a coordinate plane. They match points with letters and graph a line through all the plotting to create a straight line. There are 25 questions with an answer key.
Curated OER
Line Graphs
For this line graphing worksheet, learners read a table showing items four children "posses" and plot graphs for each child showing the distribution of objects they each have. Students plot four line graphs.
CK-12 Foundation
Graphs of Linear Systems: Star Lines
Let the class stars shine. Using four given linear equations, scholars create a graph of a star. The pupils use the interactive to graph the linear systems and determine the points of intersection. Through the activity, classmates...
Curated OER
Line Graph: To Grandmother's House We Go
In this line graph worksheet, students use a line graph showing distance traveled to answer a set of 4 related questions. Answers are included on page 2.
Virginia Department of Education
Graphs
Examine different types of graphs as a means for analyzing data. Math scholars identify the type of graph from a series of data displays and then develop questions to match each one. Then, given a scatter plot of height versus age...
CK-12 Foundation
Identify Functions and the Vertical Line Test: The Vertical Line Test
There's no easier test than the vertical line test. Learners drag a vertical line across the graphs of several relations in an interactive. They answer a set of challenge questions that focus on whether the graphs represent functions.
CK-12 Foundation
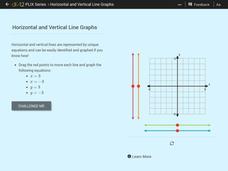
Horizontal and Vertical Line Graphs
See how vertical and horizontal lines have special equations. Scholars drag vertical and horizontal lines onto a coordinate plane to graph given equations. They then answer a set of challenge questions on the topic.
Willow Tree
Bar Graphs
Circles, lines, dots, boxes: graphs come in all shapes in sizes. Scholars learn how to make a bar graph using univariate data. They also analyze data using those bar graphs.
Curated OER
Generate Measurement Data Word Problems
Bar and line graphs are an excellent way to visually analyze data: give your scholars practice both analyzing graphs and creating their own! First, they examine five basic bar graphs, indicating the number of squares on specific days....
Curated OER
Quiz: Reading and Making Line Plots
In this reading and making line plots worksheet, students create a line plot for given sets of numbers. In addition, they read graphs and interpret the average. This one-page worksheet contains ten problems.
Willow Tree
Graphing
So many methods and so little time! The efficient method of graphing a linear equation depends on what information the problem gives. Pupils learn three different methods of graphing linear equations. They graph equations using...
Willow Tree
Line Plots
You can't see patterns in a jumble of numbers ... so organize them! Learners take a set of data and use a line plot to organize the numbers. From the line plot, they find minimum, maximum, mean, and make other conclusions about the...
CK-12 Foundation
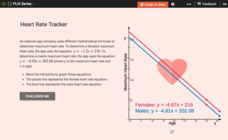
Graphs of Linear Systems: Heart Rate Tracker
Max out heart rates for males and females. Formulas of maximum heart rates provide the equations for a linear system. Pupils use the interactive to graph the equations for males and females and determine their points of intersection. The...


