Flipped Math
Graphing Polynomial Functions
Take a look in the window. Pupils watch a presentation to discover how to graph a polynomial using a graphing calculator and using the window to find the extrema. Scholars use their knowledge from previous lessons to gain a rough idea of...
Curated OER
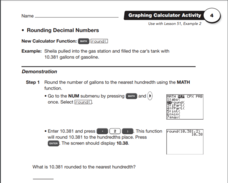
Rounding Decimal Numbers: Graphing Calculator Activity
In this math learning exercise, students use graphing calculators to complete a total of three problems with rounding decimal numbers. Diagrams are included in student instructions.
EngageNY
Graphs Can Solve Equations Too
There are many equations Algebra I students are not ready to solve. Graphing to solve gives them a strategy to use when they are unsure of an algebraic approach to solve the problem. The lesson exposes learners to a wide variety of...
Shodor Education Foundation
Graph Sketcher
Sketch graphs with the Graph Sketcher. Scholars graph functions on a coordinate plane. An interactive makes it as easy as inputting the function and clicking a button.
Shodor Education Foundation
Graphit
No graphing calculator? No worries, there's an app for that! Young mathematicians use an app to graph functions. In addition, they can also plot data points.
EngageNY
Graphs of Quadratic Functions
How high is too high for a belly flop? Learners analyze data to model the world record belly flop using a quadratic equation. They create a graph and analyze the key features and apply them to the context of the video.
Curated OER
Graphing Calculator Activity: Multiplying and Dividing Mixed Numbers
In this graphing calculator worksheet, students explore necessary steps to multiply and divide mixed numbers using a graphing calculator. In groups, students measure objects in their classroom and write equations using their collected...
EngageNY
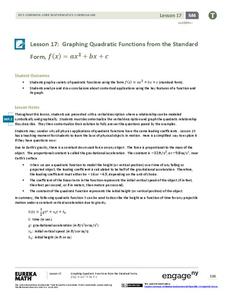
Graphing Quadratic Functions from the Standard Form
Use context to explain the importance of the key features of a graph. When context is introduced, the domain and range have meaning, which enhances understanding. Pupils use application questions to explore the key features of the graph...
PHET
Graphing Lines
Ready to increase pupils' understanding of slope with an upward slope? Scholars use an interactive that allows users to move two points on a coordinate plane. The interactive then automatically calculates the slope, the slope-intercept...
Curated OER
Number Line: Negative Numbers
In this graphing calculator worksheet for the TI-83 calculator, middle schoolers first observe a demonstration for calculating negative numbers. Next, students use their graphing calculator to answer 6 thoughtful T/F and short answer...
Virginia Department of Education
Transformational Graphing
Find relationships between the structure of a function and its graph. An engaging lesson explores seven parent functions and their graphs. Learners match functions to their graphs and describe transformations.
Curated OER
Trigonometry and the Calculator
In this geometry worksheet, 10th graders use a graphing calculator to evaluate trigonometric functions and their inverses. The four page worksheet contains explanation, examples, and twenty questions. Answers are not...
Willow Tree
Line Graphs
Some data just doesn't follow a straight path. Learners use line graphs to represent data that changes over time. They use the graphs to analyze the data and make conclusions.
Willow Tree
Circle Graphs
Pie isn't just for eating! Scholars learn to create pie charts and circle graphs to represent data. Given raw data, learners determine the percent of the whole for each category and then figure out the degree of the circle that percent...
Flipped Math
Unit 5 Review: Systems of Equations
Activate transformers along with algebra systems. Pupils use 10 problems to review transformations of functions to solve a variety of systems of equations. Individuals identify the types of transformations from an equation along with...
Curated OER
Graphs to Represent a Data Set
By analyzing a word problem about hours worked in a week, scholars get valuable practice with bar graphs and data analysis. They read the scenario, then examine a table of data taken from it. The data includes four days and the...
Curated OER
Graphs to Represent a Data Set
Here are Jack's hours for the week; scholars organize them into a bar graph in this data analysis worksheet. They write the days along the y-axis and hours along the x-axis. Encourage labeling for this. Consider projecting as an...
Curated OER
Graphing Calculator Activity
In this graphing calculator learning exercise, students explore the steps to analyze a complex fraction using a graphing calculator. They simplify a complex fraction to a proper fraction. This four page learning exercise contains...
EngageNY
Graphing Quadratic Equations from the Vertex Form
Graphing doesn't need to be tedious! When pupils understand key features and transformations, graphing becomes efficient. This lesson connects transformations to the vertex form of a quadratic equation.
Shodor Education Foundation
Function Flyer
Fly through graphing functions with the Function Flyer. Young mathematicians use an interactive to graph different types of functions. A set of exploration questions has users investigate patterns in functions.
Math Worksheets Land
Pie or Circle Graphs—Step-by-Step Lesson
How do you display data that you've collected in a pie chart? Follow a clear step-by-step guide to turning survey results into a visible format. It shows kids how to determine the percentage of the whole that each section represents.
Pingry School
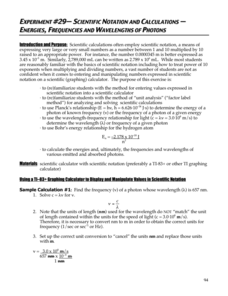
Scientific Notation and Calculations – Energies, Frequencies, and Wavelengths of Photons
The calculator has an interesting way of displaying numbers in scientific notation, but don't let that confuse your pupils! A lesson designed to give learners practice with scientific notation and calculators provides several practice...
Teach Engineering
Start Networking!
Class members create their own social networks by collecting signatures before graphing the interactions with their fellow classmates. The degree distribution of the simulated social network is determined by calculating the degree of...
Flipped Math
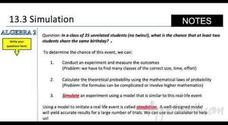
Simulations
Simulate an exciting graphing calculator-based lesson. Individuals watch and participate creating simulations using the random number generator in a graphing calculator to answer probability problems. Learners then build simulations to...


