All-in-One High School
Elements of Plot
Cinderella wants to go to the ball and marry the prince. At the end of the story, she does! But how does the plot move from the exposition to the resolution? Teach language arts learners and fairy tale fans about the basics of plot...
Willow Tree
Scatterplots and Stem-and-Leaf Plots
Is there a correlation between the number of cats you own and your age? Use a scatter plot to analyze these correlation questions. Learners plot data and look for positive, negative, or no correlation, then create stem-and-leaf plots to...
Soft Schools
Plot — 3rd or 4th Grade
After reading a version of "The Tortoise and the Hare," scholars complete a plot diagram. They pinpoint the tale's beginning, rising action, climax, falling action, and ending.
Shodor Education Foundation
Scatter Plot
What is the relationship between two variables? Groups work together to gather data on arm spans and height. Using the interactive, learners plot the bivariate data, labeling the axes and the graph. The resource allows scholars to create...
Texas Education Agency (TEA)
Isolated Scenes and Plot Support (English II Reading)
And the plot thickens! The third interactive in this series introduces young scholars to the cause-and-effect nature of a fictional story plot. They learn about the characteristics of exposition, rising action, climax, falling action,...
Pinecrest Preparatory Middle and High School
Short Story Planning Guide
A short story is only as strong as its characters, development, and conflicts. Encourage the young authors in your class to plan their stories based on the elements of narrative writing, all provided in brainstorming graphic organizers.
Shodor Education Foundation
Box Plot
What information can come from a box? Learners choose a data set to display as a box plot and decide whether to include the median in the calculation of the quartiles, show the outliers, and change the scale. To finish the lesson,...
Virginia Department of Education
Scatterplots
Math is all fun and games with this activity! Learners use an activity designed around hula hoops to collect data. They create scatter plots with their data and then analyze the graphs for correlation.
Scholastic
A Reading Guide to A Wrinkle in Time
Accompany a reading of Madeleine L'Engle's classic tale, A Wrinkle in Time, with a detailed guide equipped with 15 informative and useful chapters. Scholars discover who the author is, why she wrote the book, and crucial story elements...
Vanier College
Analyzing Short Stories/Novels
Good questions can help focus readers' attention on the elements writers use to add depth to their stories. The questions on this worksheet do just that and encourage readers to think critically about a story and author's purpose.
Curated OER
To Kill a Mockingbird Study Guide Part II
Focus your class's reading of To Kill a Mockingbird with this resource. Eighty-three questions are provided for chapters 12-31, the majority of which focus on plot recall. Since this is a word document, you can consider adding questions...
Shodor Education Foundation
Stem and Leaf Plotter
The key is in the leaves. Pupils enter data to create a stem-and-leaf plot. The resource then displays the plot and calculates the mean, median, and mode of the data. Using the plot and the calculated measures of spread, learners analyze...
Shodor Education Foundation
Simple Coordinates Game
Let coordinate pairs show you the way home. Scholars plot houses on a coordinate plane with given coordinates using an interactive app. Alternatively, they can identify the coordinates of houses already plotted on a coordinate plane.
Virginia Department of Education
Graphs
Examine different types of graphs as a means for analyzing data. Math scholars identify the type of graph from a series of data displays and then develop questions to match each one. Then, given a scatter plot of height versus age...
Achieve
BMI Calculations
Obesity is a worldwide concern. Using survey results, learners compare local BMI statistics to celebrity BMI statistics. Scholars create box plots of the data, make observations about the shape and spread of the data, and examine the...
Statistics Education Web
Text Messaging is Time Consuming! What Gives?
The more you text, the less you study. Have classes test this hypothesis or another question related to text messages. Using real data, learners use technology to create a scatter plot and calculate a regression line. They create a dot...
PBL Pathways
Students and Teachers
Predict the future of education through a mathematical analysis. Using a project-based learning strategy, classes examine the pattern of student-to-teacher ratios over a period of years. Provided with the relevant data, learners create a...
EdHelper
George Washington's Socks by Elvira Woodruff
A solid, straightforward book report form is an excellent addition to your literature unit. Class members note the main characters, point of view, plot elements, and other important details from a story, adding their favorite part...
Radford University
Sleep and Teen Obesity: Is there a Correlation?
Does the number of calories you eat affect the total time you sleep? Young mathematicians tackle this question by collecting their own data and making comparisons between others in the class through building scatter plots and regression...
Curated OER
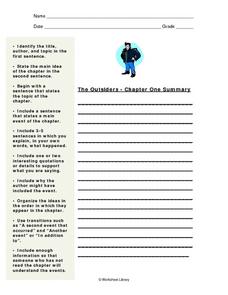
Plot Summary: The Outsiders
In this plot summary worksheet, students are given several prompts to assist in developing a summary of the first chapter of The Outsiders.
Curated OER
My Antonia: Concept Analysis
Use this analysis of My Antonia to help inform your instruction and prepare your pupils for the project and enrichment ideas listed at the end of the resource. The analysis covers big questions related to the text, themes, plot elements,...
Curated OER
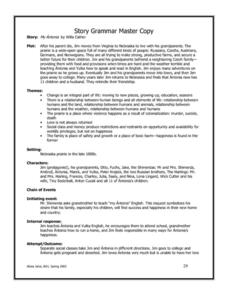
My Antonia: Story Grammar
Pupils can write down all of the major plot elements of My Antonia by Willa Cather on this straightforward worksheet. Learners note down themes, characters, the chain of events, and more.
Curated OER
Reading Study Guide: I Know Why the Caged Bird Sings
Meant for use with Maya Angelou's first autobiographical volume I Know Why the Caged Bird Sings, the materials here are designed for a homeschool setting, but they'd suit any classroom or text. Graphic organizers, chapter summary...
Shodor Education Foundation
Data Flyer
Fit functions to data by using an interactive app. Individuals plot a scatter plot and then fit lines of best fit and regression curves to the data. The use of an app gives learners the opportunity to try out different functions to see...
Other popular searches
- Character and Plot Development
- Reading Plot Development
- Stages of Plot Development
- Analyze Plot Development
- Plot Development Art
- Stories Plot Development
- Plot Development in Writing
- Writing, Plot Development
- Plot Development Lesson
- Writing Plot Development


