Curated OER
Saving Energy Through Ecological Landscape Design
Students are able to transcribe to scale the plant features of a common landscape. They determine true north and south and collect and record data on a table. Students calculate a rating for and describe a definition of insulation and...
Curated OER
Tasty Tech Activity With Excel
Students are introduce to basic Excel skills, rank their opinions of menu items from fast food restaurants, add their answers to the spreadsheet, and then create a simple graph of the results.
Curated OER
Oil Spill
Pupils use one of four absorbent products to separate as much of the oil and water mixture they are able to do. The purpose of this task is for students to collect and analyze data for the purpose of determining which absorbent is best,...
Curated OER
Classification in Action
Students work with a set of objects to set up both quantitative and qualitative classification systems. As a group, students follow an example to design and complete two classification systems using a set of objects provided. ...
Curated OER
Grade 5: Alphabet Frequency
Fifth graders collect and organize data from writing samples, use fractions and decimals to describe the experimental data, and use the experimental results to make predictions about the frequency of letter usage in the English language.
Curated OER
Do Caterpillars Eat More As They Get Bigger?
Learners observe caterpillar behavior and the amount of milkweed leaves the caterpillars eat each day. They collect data regarding the caterpillar's size and anything else they see. They look for patterns in caterpillar eating habits and...
Curated OER
Weather Predictions
Students record weather data and create a five day forecast. Students investigate the roles of meteorologists and identify symbols used on a weather map. After gathering weather data for a week, students will create a five day forecast...
Curated OER
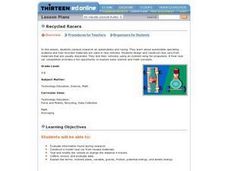
Recycled Racers
Students research automobile operating systems in relation to racing. They design and construct vehicles from recycled material which they race to study the concept of propulsion.
Curated OER
Vital Signs
Students research health-related topics such as good nutrition, exercise, and the human body. They analyze their data and distribute it through the use of the Internet.
Curated OER
Computer Graphing
Students research the Internet or create surveys to find graphable data. They collect, organize, analyze and interpret the data. Finally, they choose the appropriate type of graph to display the data and find the measures of central...
Curated OER
Positive Future Fair Project
Ninth graders view the film "Pay It Forward" and discuss what kind of public campaign is needed to move people to positive action. They consider different ways of presenting information (graphs, visual displays, etc.) as tools for...
Curated OER
Everybody Needs a Rock
Students, after making quantitative and qualitative observations of their rocks, construct a Venn diagram or dichotomous key to classify their rocks.
Curated OER
Groundwater and Ecology
Students are presented a problem concerning an aquifer which may be in danger from overuse by agriculture/industry. They compile data and consult online data and experts in creating a proposal to rectify the situation.
Curated OER
Dough Lake Topology
High schoolers practice coordinates and measurements, develop 2D, 3D topological map, construct grid with string on real surface, establish "level" fixed point for measurements, take and record data points of elevation, and enter data on...
Curated OER
Spinner Experiment
Students collect and analyze data, then draw conclusions from the data and apply basic concepts of probability.
Curated OER
Get the Picture with Graphs
Fifth graders examine line, bar and circle graphs in the newspaper and on the Internet. They complete sketches of graphs with an emphasis on selecting the best model to depict the data collected.
Curated OER
Lyrics Statistics
Students describe, analyze and generalize relationships, patterns, functions using words. symbols, variables, tables and graphs.
Curated OER
Brain Brands
Students explore the advent of neuromarketing as a means to assess the effects of certain brands on the brain activity of prospective buyers. They design their own experiments that test the power of certain brands on a sample population.
Curated OER
Shaquille O'Neal Hand/Foot Span
Eighth graders measure foot length and hand span in this experiment to determine the ratio. They apply the ratio to determine Shaquille O'Neal's hand span if given his shoe size.
Curated OER
Spaghetti Bridges
Eighth graders experiment with building bridges of spaghetti, pennies, and a cup to determine how varying the number of spagetti pieces affects the strength of the bridge. They graph their results and interpret the data.
Pennsylvania Department of Education
Eye to Eye
Students practice the concept of posing mathematical questions regarding themselves and their surroundings. In this eye to eye lesson plan, students gather data about eye color from their classmates. Students organize their data in order...
Curated OER
Investigating: Interpreting Graphs and Analyzing Data
Students explore statistics by researching class birthday data. In this data analysis lesson, students investigate the different birthdays among their classmates and create data tables based on the given information. Students view bar...
Curated OER
Qualitative and Quantitative Data
Seventh graders study the different ways that they have been evaluated over the years. In this qualitative and quantitative activity students complete a learning activity while in groups.
Curated OER
And Now, the Weather...
Young scholars collect and analyze data. In this middle school mathematics/science lesson, students collect temperature reading over a 24 hour period. Young scholars analyze the data for mean, median, maximum and minimum.


