Bloomberg
BofAML's Subramanian Suggests Investors 'Hide' in Financials
May.17 -- Savita Subramanian, head of U.S. equity and quantitative research at Bank of America Merrill Lynch, explains why she sees opportunities in the financial sector. They speak with Bloomberg's Jonathan Ferro on "Bloomberg Markets:...
Bloomberg
BlackRock's Li Says U.S. Markets to Outperform Europe's
Wei Li, chief global investment strategist at BlackRock Investment Institute, says U.S. markets will outperform their European counterparts due to the local economic drag of the conflict in Ukraine. "The war in Ukraine will impact...
Bloomberg
UniCredit’s Bandholz Sees 3.0% U.S. Jobless Rate
Jun.30 -- Unicredit Chief U.S. Economist Harm Bandholz sees a 2019 surprise: U.S. unemployment at 3 percent. That gives him the outlier call among eco-watchers. It follows Evercore ISI Chairman Ed Hyman's prediction that the jobless rate...
Bloomberg
How Benchmark's Kevin Kelly Is Trading Alibaba
Jun.19 -- Kevin Kelly, Benchmark managing partner, discusses his options strategy with Bloomberg's Julie Hyman on "Bloomberg Markets.
Bloomberg
Why Investors Are Reacting Negatively to Clinton Probe
Oct. 28 -- Patrik Schowitz, JPMorgan Asset Management global strategist, discusses the impact of political uncertainty on financial markets. He speaks with Bloomberg's Scarlet Fu and Matt Miller on "Bloomberg Markets."
Bloomberg
Citigroup's Morse Sees a Need to Extend OPEC Deal
Feb.23 -- Ed Morse, global head of commodities research at Citigroup, examines Mexican oil production, U.S. energy policy, and the impact of OPEC's output cut. He speaks on "Bloomberg Surveillance."
Bloomberg
Time to Get Bonds Back Into Your Portfolio, Says UBS' Briscoe
Dec.23 -- Hayden Briscoe, head of fixed income at UBS Asset Management, discusses the Fed's impact on the bond market, inflation and the inversion of the yield curve. He speaks on "Bloomberg Daybreak: Asia."
Bloomberg
Are Markets Nearing the End of the Everything Rally?
Jul.12 -- Mandy Xu, equity derivatives strategist at Credit Suisse, Michael Hans, chief investment officer at Clarified/Citizens Private Wealth, and Jim Caron, portfolio director at Morgan Stanley Investment Management, examine whether...
Bloomberg
Dollar Has Further Downside to Go, StanChart's Zhang Says
Nov.17 -- Lemon Zhang, Macro & FX Strategist at Standard Chartered, talks about the dollar, the yuan and the yen. She speaks with Shery Ahn and Paul Allen on "Bloomberg Daybreak: Asia."
Bloomberg
Yields Have a Way to Go Before Troubling Equities: JPM’s Craig
Mar.03 -- Kerry Craig, global market strategist at JPMorgan Asset Management, discusses bond yields and their impact on equity markets. He speaks on “Bloomberg Daybreak: Asia.”
Flipped Math
Correlation
Determine how close the line is to the scatter plot. Clear video instruction shows how to plot a scatter plot and find the best fit line using the linear regression function on a calculator. Pupils use the information from the calculator...
Flipped Math
Best Fit Lines
What fits best? Pupils watch a video that reviews creating a scatter plot. Learners develop an understanding of correlation and determine whether it is moderate, strong, or none as well as positive or negative. Finally, they use a...
Crash Course
Correlation Doesn't Equal Causation: Crash Course Statistics #8
There's likely a strong correlation between watching the video and learning about causation. Scholars hear about different types of correlation and correlation coefficients through the informative YouTube video. They also see how...
Mathed Up!
Scatter Graphs
Make an estimate by getting in line. The class works with scatter plots and lines of best fit to make an estimate for given values. Pupils determine whether there is a positive or negative correlation and draw a best-fit line. Using the...
National Education Association
Inappropriate Data Usage
Correlate the responses to identify the cause. A resource presents how individuals sometimes confuse the issue between correlation and causation. The video provides examples of different variables that are correlated — but one does...
Northeast Arkansas Education Cooperative
Scatter Plots
Show learners how to plot data to determine correlation. A data analysis video gives examples of positive, negative, and no correlation between variables. The final example plots real-life data, provides a line of best fit, and...
Curated OER
How Do You Use a Scatter Plot to Find a Negative Correlation?
Organize your data on a graph. Use the data, pair them up as coordinate pairs, then graph them, resulting in a scatter plot. But how, you ask? Watch this tutorial to learn the step-by-step process needed to draw a scatter plot and...
Khan Academy
Khan Academy: Fundamentals: Correlation and Causation
In this Wireless Philosophy video, Paul Henne (Duke University) explains the difference between correlation and causation. [7:08]
Loyola University Chicago
Math Flix: Graphs: Scatter Plot Creating
This QuickTime movie provides an opportunity to create a graph that is a scatter plot. A pdf worksheet is available by clicking on the hyperlink at the bottom of the page. As you watch and listen to the teacher and student interact it...
Sophia Learning
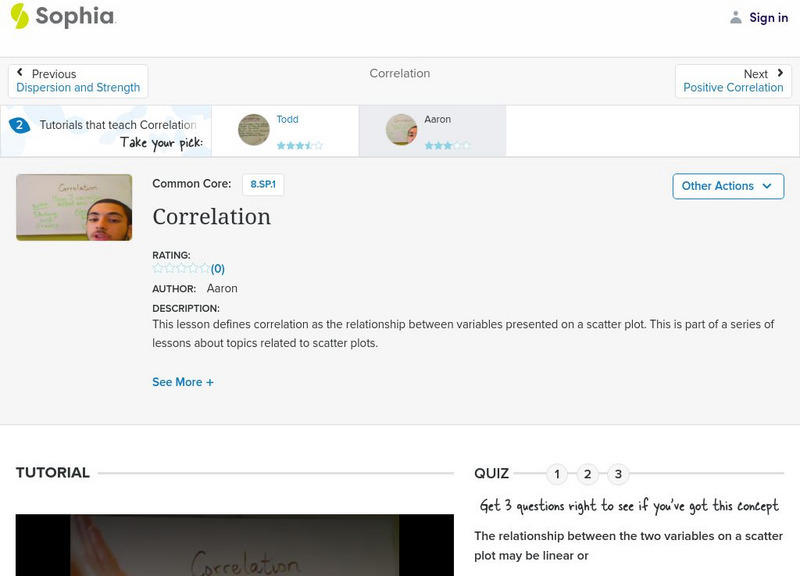
Sophia: Correlation
This lesson defines correlation as the relationship between variables presented on a scatter plot.
Sophia Learning
Sophia: Correlation: Lesson 2
This lesson defines correlation as the relationship between variables presented on a scatter plot. This is part of a series of lessons about topics related to scatter plots. It is 2 of 9 in the series titled "Correlation.' [3:31]
Sophia Learning
Sophia: Correlation: Lesson 3
This lesson defines correlation as the relationship between variables presented on a scatter plot. This is part of a series of lessons about topics related to scatter plots. It is 3 of 9 in the series titled "Correlation." [2:04]


