Hi, what do you want to do?
National Wildlife Federation
Get Your Techno On
Desert regions are hotter for multiple reasons; the lack of vegetation causes the sun's heat to go straight into the surface and the lack of moisture means none of the heat is being transferred into evaporation. This concept, and other...
NASA
Erosion and Landslides
A professional-quality PowerPoint, which includes links to footage of actual landslides in action, opens this moving lesson. Viewers learn what conditions lead to erosion and land giving way. They simulate landslides with a variety of...
Curated OER
Ecosystems and Remote Sensing
Middle schoolers obtain remote sensing data to compare and contrast global biomass data with global temperature data.
NASA
The Heat is On: Urban Heat Islands, Detection Strategies, and Mitigation Solutions
It's sure getting hot out there! Scholars analyze satellite data on land use and surface temperatures, and then learn how to ground truth satellite data through an activity. They apply technology to identify urban heat islands and...
NASA
Speaking in Phases
Hear from deep space. Pupils learn how satellites transfer information back to Earth. They learn about three different ways to modulate radio waves and how a satellite sends information with only 0s and 1s. Using sound, class members...
American Museum of Natural History
Field Trip Earth
Take a field trip around Earth by way of satellite images. Learners watch a video lesson that describes different images taken from orbiting satellites. They then test their visual skills in a 14-question online quiz.
Discovery Education
Satellite Telemetry
Satellites require rockets to launch, but it doesn't take a rocket scientist to understand them. Future engineers learn about how satellites send data to Earth and how to interpret satellite images. They see how radio waves play a role...
PBS
Student Helioviewer Data Tool
Scholars use current satellite data to view solar events, solar features, and so much more. It allows them to make videos over time to observe patterns and visually understand the sun at a much higher level using the interactive that is...
Space Awareness
Valleys Deep and Mountains High
Sometimes the best view is from the farthest distance. Satellite imaging makes it possible to create altitude maps from far above the earth. A three-part activity has your young scientists play the role of the satellite and then use...
Space Awareness
A View From Above
Analyzing and interpreting satellite data takes knowledge and patience. Through a detailed lab investigation, young scholars learn the process of analyzing this data. They use technology to create color images and maps from real...
NOAA
Ground-truthing Satellite Imagery with Drifting Buoy Data
Ground-truthing ... is it even a word? The last installment of a five-part series analyzes how scientists collect sea surface temperature data. Scholars use government websites to compare temperature data collected directly from buoys...
NASA
Down to Earth
There are only 10 types of people in the world: those who understand binary and those who don't. The lesson includes four activities in which students learn binary, convert binary to images, understand CCD arrays, and interpret...
International Technology Education Association
Pixel This!
Did the image I drew match the image you saw? By simulating a satellite and a ground station, teams of two transmit data in the form of pixels in order to recreate an image. They use four different levels of brightness, creating slightly...
Curated OER
Using Vegetation, Precipitation, and Surface Temperature to Study Climate Zones
Using NASA's Live Access Server, earth scientists compare the temperature, precipitation, and normalized difference vegetation index for four different locations. They use the data to identify the climate zone of each location using...
Curated OER
Cold, Clouds, and Snowflakes
Students explore satellite data and graphing. In this weather data analysis math and science lesson, students analyze NASA satellite data to draw conclusions about geographical areas where precipitation might have happened. Students...
NOAA
Earth Origami
After reading a brief history of Carl Skalak's journey on the open waters, scholars make a three-dimensional model of the Earth out of an Origami balloon using a printable decorated as the Earth.
Curated OER
Explore Surface Types on a Journey Around Earth
Students explore satellite data. In this technology cross-curriculum math and world geography lesson, students locate specific map areas using a microset of satellite data. Students use technology and math skills to determine percentages...
Curated OER
Scientists Track the Rising Tide
In this tracking the rising tide worksheet, students use the data in a graph showing the seal level change versus time from 1900 to 2000 to answer 3 questions about the rising tides. Students determine the slope of a line drawn from 1920...
Curated OER
FILLING IN THE GAPS - Acquiring and Analyzing Satellite and Ground-Based Data
Students monitor rainfall, compute daily averages, and compare their methods of computation to those used by actual researchers using satellite observations.
NASA
Nasa: Cobe: Cosmic Background Explorer
The Cosmic Background Explorer, or COBE, satellite began its space mission in November of 1989. Its task was to measure radiation levels from the early stages of the universe. This site explains the mission goals, COBE's specialized...
Other
Adb: How Remote Sensing Technology Improves Efficiency of Irrigation Systems
With the increase of free satellite data combined with scientific algorithms and cloud computing capacity, developing affordable operational monitoring systems for irrigation management in Asia is now feasible. The use of virtual field...
Science Education Resource Center at Carleton College
Serc: Visualizing Carbon Pathways
This lesson introduces students to visualization capabilities available through NASA's Earth Observatory, global map collection, NASA NEO and ImageJ. Students build several animations of satellite data that illustrate carbon pathways...
Science Education Resource Center at Carleton College
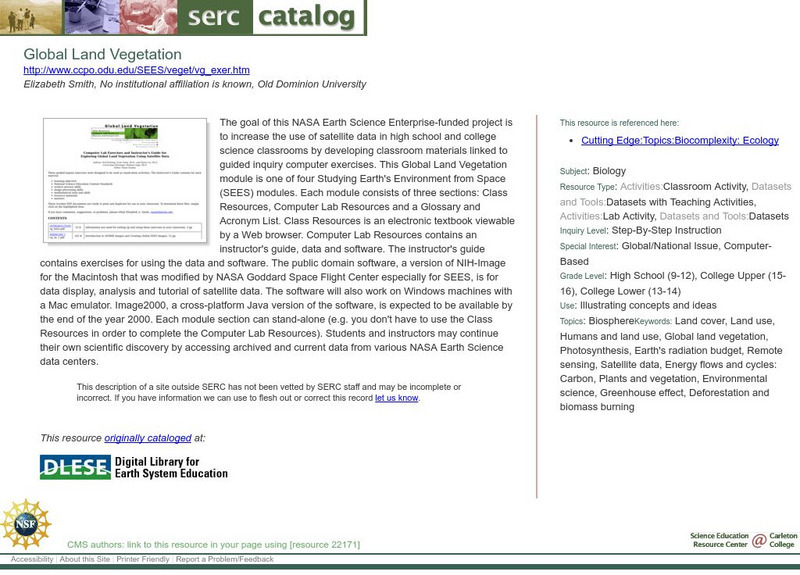
Serc: Global Land Vegetation
This Global Land Vegetation module is one of four Studying Earth's Environment from Space modules. It consists of three sections: class resources, computer lab resources, and a glossary and acronym List.
Climate Literacy
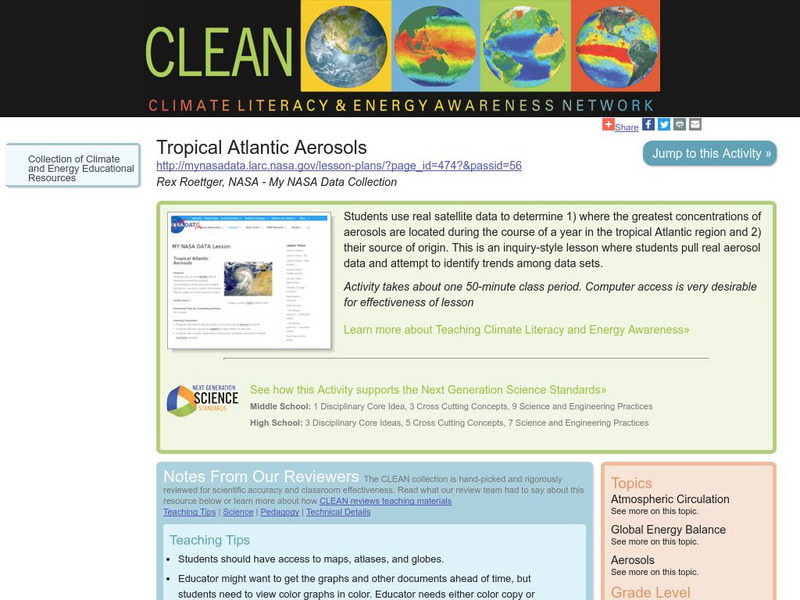
Clean: Tropical Atlantic Aerosols
Students will use real satellite data to determine where the greatest concentrations of aerosols are located during the course of a year in the tropical Atlantic region and their source of origin.


