Curated OER
Chocolate Graphing
Chocolate lovers develop a bar graph based on the types of chocolate the class likes. They participate in The Art of Chocolate at The Hershey Story before they make a bar graph that shows the favorite chocolate types of their class. They...
Baylor College
Global Atmospheric Change: The Math Link
Change up the classroom atmosphere with this interdisciplinary resource. Following along with the children's book Mr. Slaptail's Curious Contraption, these math worksheets provide practice with a wide range of topics including...
Google
Graphing with Google Docs & Forms
Get to know your class and teach about data analysis all with the help of Google Docs. Using student-generated questions, create a class survey using Google Forms. Reserve time in the computer lab for learners to complete the form and,...
Curated OER
Easter Graphing Fun
Graphing can be festive! This Easter worksheet has scholars using coordinates to record the location of ten holiday images. The first is done for them, and the grid is large and appealing to younger learners. Consider visualizing this...
Royal Baloo
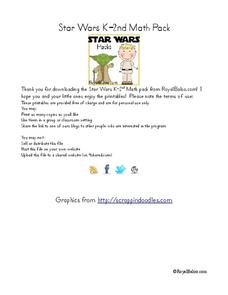
Star Wars K-2nd Math Pack
Included in a Star Wars themed packet, young padawans enhance mathematical skills such as graphing, computing using basic operations, counting numbers and money, telling time, and measuring. Scholars play a game of sudoku, read...
Heidi Songs
Zoo Animal Probability Graph
Capture the engagement of your young mathematicians with a collaborative graphing activity. Using a deck of zoo animal picture cards, students select a picture from the deck, record the chosen animal on a graph,...
Mixing In Math
Mixing in Math: Growing Plants
Whether you have your class plant seeds or begin when sprouts are visible, math skills are used here to predict and track growth over time. Straw bar graphs show plant height on a given day while the graph as a whole shows changes over...
Curated OER
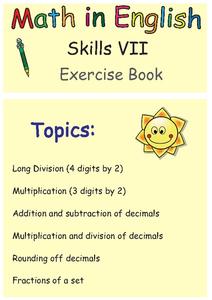
Math in English Skills VII Exercise Book
A great way to help struggling learners with long division is to provide graph paper. These worksheets provide handy boxes to help kids keep all that great work in the right order. It also provides over 20 worksheets to help pupils...
Curated OER
Use a Graph Practice 4.8
What do you like to do after school? Study this bar graph and have learners answer the five questions that follow. Consider asking learners to draw their own bar graph for number five (even though the question can be answered without...
Worksheet Place
How I Get to School
Find out how many of your learners take the bus, how many walk, and how many bike with a quick survey. Class members gather data about how each individual gets to school and mark the results on this page in order to create a bar graph.
Curated OER
Feature column: Hands on Math With Technology
Young learners will view a math adventures video and practice math concepts. Afterwards they will navigate through Internet sites to participate in teacher selected math adventures. This guide walks you through integrating...
Curated OER
Which is Your Favorite Season?: Graph
Here is a clever seasons bar graph worksheet. Children will ask their classmates which season they prefer, and record the responses to complete the graph.
Curated OER
Create a Graph Online
Scholars create colorful bar, line, or pie graphs. They decide on a survey question to ask or a type of data to gather. From there, they collect information and data. They display this data in bar, line, or pie graphs that they create...
Curated OER
Graphing It Daily
Students identify and demonstrate a positive learning attitude and use basic concepts and skills. Learners also communicate clearly in oral, artistic, written, and nonverbal form. Finally, students participate in the daily data...
Curated OER
Interpreting Graphs and Analyzing Data
Students investigate graphs and analyze the data displayed in the graph. They read a graph reflecting the birthday data for the students to read and analyze. Students use the graph to determine the number of birthday cards they need to...
Curated OER
Graph the Results: Applesauce Taste Test
Students work together to make applesauce following specific directions. They taste each applesauce and graph the results based on the taste test. They also use the internet to create an online graph.
Curated OER
Apple Graphing
Do you like apples? Create a taste test for your first and second grade learners. Cut red, green, and yellow apples, and have learners select their favorite. After tasting all of the apples, they collect data and graph the results with...
Curated OER
Using Graphs and Charts
Students complete T charts and manipulate numbers using graphs and charts. In this math graphs and charts lesson, students review the concepts of pattern and function. Students then complete practice pages where they manipulate numbers...
Curated OER
"Eggs-ploring" Math with Jellybeans
Learners work in pairs with a small bag of jellybeans to estimate the number of candies in their bags and then figure out how many groups of 10 jellybeans are contained in their bags. They then graph the information using a pictograph or...
Oklahoma State University
Math for Peanuts
Peanuts! Get your peanuts! Kids explore math, art, and agriculture concepts focused on peanuts. There is a brief informational text to get them started, and you'll find definitions of five in-text vocabulary words to address. Kids...
Curated OER
Yummy Math
Young mathematicians use bags of Skittles to help them gain practice in graphing and organizing data. They work in pairs, and after they have counted and organized their Skittles, they access a computer program which allows them to print...
Curated OER
M&M Graphing
Youngsters sort M & M's by color. They graph the M&M's by color on a graph. This classic lesson is a wonderful way to introduce the concept and technique of graphing to young mathematicians. Pairs of kids can make up their own...
Curated OER
First Grade Math
In this math assessment worksheet, students answer 25 multiple choice questions that pertain to all math skills in grade one.
Illustrative Mathematics
Favorite Ice Cream Flavor
What better way to engage children in a math lesson than by talking about ice cream? Using a pocket chart or piece of chart paper, the class works together creating a bar graph of the their favorite ice cream flavors. Learners then work...
Other popular searches
- Charts and Graphs Math
- Hidden Picture Math Graphs
- Misleading Graphs Math
- Powerpoint Math Graphs
- 1st Grade Math Graphs
- Math Graphs 4th Grade
- Math Reading Graphs
- Animals Math Graphs
- Math Graphs Grade 1
- Creating Math Graphs
- Math Graphs Using M&ms
- Math Interpreting Graphs


