Curated OER
Did Voters Turn Out -- or Are They Turned Off?
What was the voter turnout at your last state election? Examine voter turnout statistics from the most recent election to learn which ten states have the best turnout record. This lesson offers election data, handouts, and worksheets.
Education World
The African American Population in US History
How has the African American population changed over the years? Learners use charts, statistical data, and maps to see how populations in African American communities have changed since the 1860s. Activity modifications are included to...
Curated OER
Percentage
In this finding the percent of whole numbers worksheet, students calculate the percent to problem solve. Students solve 10 problems.
Curated OER
Comparing Apples With Apples 1
Elementary schoolers observe and demonstrate how to add and subtract fractions with like denominators. They observe the teacher model a variety of fraction addition and subtraction problems and use fraction strips to complete a worksheet.
Curated OER
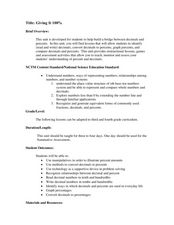
Giving it 100%
Students build knowledge about the number relationships between decimals and percents as it relates to converting decimals into percents. In this decimal and percent lesson, students recognize equivalent forms of fractions, decimals, and...
Curated OER
Not Everything is More Expensive
Students compare prices and determine percent increases and decreases of items in order to make wise purchases. In this percent increases and decreases lesson plan, students calculate the amounts based on grocery store ads.
Curated OER
The Discount is Right
Students visit various websites and calculate various prices of five items. They estimate the sale price of five items using the original price and discount rate, use percent to calculate the rate of discount and the original price, and...
Curated OER
Number: Percentages
Students practice and then have a race to calculate percentage and fractional parts. In this percent and fraction activity, students start with 1% and work their way up. After each practice a quick race takes place. Students complete a...
Curated OER
ISTEP + Grade 6 Item Sampler
In this cross-curricular sampler of worksheets, students determine the meaning of specialized vocabulary and to understand the precise meaning of grade-level-appropriate words, describe and connect the essential ideas, arguments, and...
Hawaiʻi State Department of Education
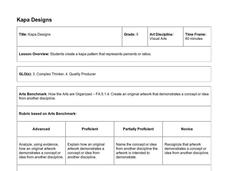
Kapa Designs
I always knew there was a connection between art and math, and this lesson proves it. Fifth graders will use what they know about ratios and percents to design art inspired by Polynesian kapa cloth. A grid, specific guidelines, and the...
National Wildlife Federation
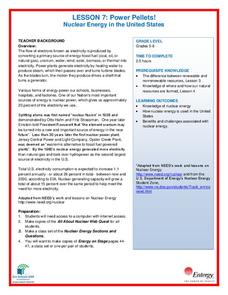
Power Pellets! Nuclear Energy in the United States
Nuclear power provides about 20 percent of the energy generated in the United States. The seventh activity in the series of 12 tackles nuclear power. After sharing what they know about nuclear energy, scholars complete a WebQuest make a...
Curated OER
Thirsty Rocks: Please "Porous" a Drink!
A simple activity goes a long way in demonstrating the property of porosity to your rock hounds. They will mass a specimen of dry sandstone and then soak it in a pre-measured amount of water. After seven minutes, they once again measure...
National Wildlife Federation
Lights, Camera, Action! Conducting an Energy Audit
Thirty percent of energy used by schools is used inefficiently! Part two in the series of 12 has groups perform energy audits of their schools as part of the Cool Schools Challenge. Each group is assigned a specific room, performs the...
US Geological Survey
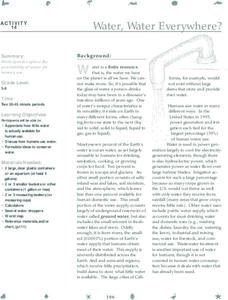
Water, Water, Everywhere?
Less than one percent of the earth's water is available for human use. A hands-on activity models the phenomenon for young scientists. Beginning with a specific volume of water, learners remove water that correlates to the percent of...
Illustrative Mathematics
Anna in D.C.
The amount of tax and tip on a restaurant bill is a common example used in percent problems. Here, learners only know the total amount paid, and they need to figure the itemized amounts. Solutions using a ratio table, using knowledge of...
Curated OER
Gold Rush California and its Diverse Population
Young scholars compare contemporary cultural differences with historical differences based on population percentage. In this cross-curriculum Gold Rush/math lesson, students analyze aspects of California's Gold Rush population and...
Institute of Electrical and Electronics Engineers
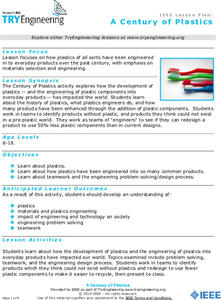
A Century of Plastics
After reading about polymer materials, engineer trainees examine how plastics have been integrated into everyday products. In groups, they compile a list of products made entirely without plastics and then, as a closing activity, try to...
National Wildlife Federation
How Do You Feel About Water?
Less than one percent of the water on Earth is usable in people's homes. As pupils consider this fact, they reflect on their own water usage before designing a survey to collect information on water usage by others. They then analyze...
Curated OER
Black Tiger Academy Martial Arts Fitness Unit – Lesson 13
"You can never conquer the mountain. You can only conquer yourself."—Jim Whittaker. Black Tiger Academy’s martial arts lesson 13 of 20 takes the health lesson about sugars to the next level by talking about diabetes. The percent of...
Baylor College
Using Food Labels
Help your class make sense of nutrition labels with the ninth lesson of this series. After explaining the different information provided on packaged food labels, perform an activity that demonstrates the amount of sugar in a single can...
National Wildlife Federation
The Amazing Adventures of Carbon: How Carbon Cycles through the Earth
Here's a stat for your pupils: 18 percent of the human body is carbon! Part 10 in the series of 12 takes pairs on an adventure through the carbon cycle. After a class reading about carbon, pairs read and choose their own adventure...
Curated OER
Decimal Baseball
Young mathematicians represent recorded information in decimal form. In this decimals instructional activity, learners play a "classroom friendly" basketball game in which pupils take 10 shots. Number of shots made out of 10 is recorded...
Curated OER
Coal Supply and Demand
A hands-on simulation perfect for an economics lesson, young learners investigate the availability of different sources of natural energy (coal, natural gas, oil, solar, and nuclear) and how this availability affects their cost. Simulate...
Curated OER
Making a Circle Graph of a Sample Budget
Students examine a sample budget and categorize the entries as a group. Then in small groups they convert budget category totals to percents and degrees to make a circle graph related to a sample budget.
Other popular searches
- Fractions Decimals Percents
- Fraction Percents
- Ratios and Percents
- Decimals and Percents
- Fractions to Percents
- Fractions and Percents
- Dividing Percents
- Decimals Percents
- Fractions Decimals Percents
- Fractions, Decimals, Percents
- Applied Math Percents
- Decimals to Percents


