Curated OER
Make a Paper Mache Bowl
Young scholars create a paper mache bowl. In this paper mache lesson, students use wallpaper paste, newspapers, and paint brushes to construct a paper mache bowl. Young scholars decorate their bowl with unique designs.
Math Moves U
Collecting and Working with Data
Add to your collection of math resources with this extensive series of data analysis worksheets. Whether your teaching how to use frequency tables and tally charts to collect and organize data, or introducing young...
Alabama Learning Exchange
Poppin' For Popcorn!
Students graph data from different popcorn flavors. In this graphing lesson, students make graphs using an assigned web site after collecting data about the flavors of popcorn that fellow classmates prefer.
Curated OER
Snack Attack
Students design charts, tables, graphs, and pictographs to analyse the types of snacks in a bag.
Curated OER
Yummy Apples!
Students discuss apples and how they are grown. They listen as the teacher reads "Apples," by Gail Gibbons. Students discuss the story. They view several different types of apples and compare their characteristics. Students taste several...
Curated OER
Clouds
Students explore basic cloud types and the weather associated with each one. In this earth science lesson, students participate in numerous activities including going outside to observe the clouds they see, making a cloud in a...
Curated OER
Birthdays
Students collect data about the birth months of each classmate using a calendar. They make a table with the information before designing a pictograph using cupcake images. They answer questions using the graph.
Curated OER
C is for Cookie-A MEAN-ingful Graphing Activity
Third graders, in groups, dissect a variety of brands of chocolate chip cookies and calculate the mean for each brand. They create their own bar graphs, pictographs, and line graphs to represent information.
Curated OER
Show Me the Money
Young scholars study the monetary value of a penny, nickel, and dime. They simulate a candy store by calculating the proper amount of money needed to purchase candy. After viewing a video, they complete the "Handful of Coins" pictograph .
Curated OER
Balloon Jets
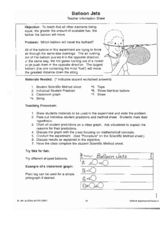
Students investigate how fuel amount affects the distance traveled by balloons. In this physics lesson, students collect data and create a pictograph. They interpret data and formulate a conclusion.
Curated OER
Graphing Fun In Third Grade
Third graders display information in a graph, table, and chart. In this data lesson plan, 3rd graders look at graphs, tables, and charts, discuss their importance, and make their own.
Curated OER
Survey Savvy
Third graders design appropriate questions for a survey, survey classmates, create a pictograph to represent the results, and explain the survey results.
Curated OER
Trash Count
Students identify pollution around their local community. They discuss the sources of polution and categorize objects based on their properties. They discover ways to make changes to the environment and how to inform the public.
Curated OER
Questions for Today: Communities
Students discover how questionnaires help communities to determine the needs of its citizens. They make an analogy between a survey of students about their school and a survey of citizens about their community.
Curated OER
Farm Census
Students disuss the work of a farmer. They recognize and name farm animals to represent the information in a pictogram.
Curated OER
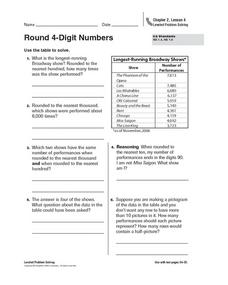
Round 4-Digit Numbers
In this rounding numbers practice worksheet, students sharpen their problem solving skills as they solve 6 story problems that require them to round 4-digit numbers.
Discovery Education
Mood Music!
Grouchy? Sad? Here's a great resource that shows kids how music can be used to lift their spirits. Kids collect and chart data on the effects of music on emotions. After analyzing the results of their experiment, they develop...
Curated OER
Many Ways to Represent Our Data
Demonstrate several ways to represent data with your class. They will use surveys to gather data and display the data using tally charts and graphs. Then answer questions according to the data.
Curated OER
Math Made Easy
Learners evaluate word problems. In this problem solving lesson, students are presented with word problems requiring graphing skills and learners work independently to solve.
Curated OER
George Washington Carver and Sharing
Students research George Washington Carver. In this science lesson, students discuss George Washington Carver's contribution to science. Students explain how peanut butter is produced.
Curated OER
Usage and Interpretation of Graphs
Cooperative groups are formed for this graphing activity. Each group must construct a graph that represents how many eyelets (the holes for laces in shoes), are present in their group. A whole-class bar graph is eventually constructed...
Curated OER
What's Data?
Students get the opportunity to investigate the concept of data collecting. They explore how to tally and read a bar graph. Vocabulary about data is also be included. At the end of the lesson, individual students collect data independently.
Alabama Learning Exchange
Inch by Inch
Third graders listen to a read-aloud of Leo Lionni's, Inch by Inch before measuring a variety of items using both standard and metric units. They record the measurement data and follow a recipe for dirt pie.
Curated OER
Where Do I Fit on the Graph?
Young scholars collect data and create graphs about themselves, their community, and the world around them. They use a variety of methods to organize data, such as stickers, clothespins, name tags, coloring, tally marks, etc.


