EngageNY
The Difference Between Theoretical Probabilities and Estimated Probabilities
Flip a coin to determine whether the probability of heads is one-half. Pupils use simulated data to find the experimental probability of flipping a coin. Participants compare the long run relative frequency with the known theoretical...
EngageNY
Chance Experiments
Class members are introduced to probability using terms such as impossible, unlikely, likely, and certain. Numbers between zero and one are associated with the descriptions of probability. Pupils find the likelihood of chance experiments...
EngageNY
End-of-Module Assessment Task: Grade 7 Mathematics Module 4
Asses the class to determine their knowledge of proportional relationships involving percents. Class members work through the nine-question assessment with a variety of percent problems. The multi-step problems involve simple interest,...
EngageNY
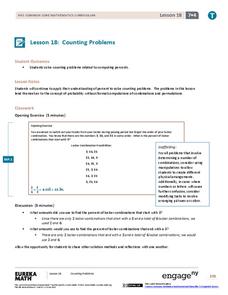
Counting Problems
Solving these percent problems is a matter of counting. Pupils find percents by counting the number of events that meet the criteria and the total number of possibilities. Participants create the ratio and convert it to a percent to...
EngageNY
Population Problems
Find the percent of the population that meets the criteria. The 17th segment of a 20-part unit presents problems that involve percents of a population. Pupils use tape diagrams to create equations to find the percents of subgroups of the...
EngageNY
Tax, Commissions, Fees, and Other Real-World Percent Problems
Pupils work several real-world problems that use percents in the 11th portion of a 20-part series. The problems contain percents involved with taxes, commissions, discounts, tips, fees, and interest. Scholars use the equations formed for...
EngageNY
Percent Error Problems
Individuals measure a computer monitor and determine how accurate their measures are. The eighth segment in a series of 20 introduces the concept of percent error. Pupils find the percent error of their measurements and discuss the...
EngageNY
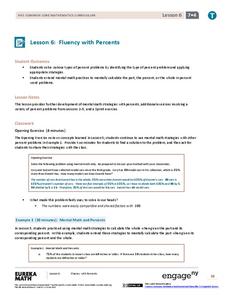
Fluency with Percents
Pupils build confidence working with percents as they work several types of percent problems to increase their fluency. The resource contains two sets of problems specifically designed to build efficiency in finding solutions of basic...
EngageNY
Percent
Extend percent understandings to include percents less than one and greater than 100. A great lesson has pupils build upon their knowledge of percents from sixth grade. They convert between fractions, decimals, and percents that are less...
Virginia Department of Education
Organizing Topic: Data Analysis
Learners engage in six activities to lead them through the process of conducting a thorough analysis of data. Pupils work with calculating standard deviations and z-scores, finding the area under a normal curve, and sampling techniques....
EngageNY
End-of-Module Assessment Task: Grade 7 Mathematics Module 5
Show learners how to use simulations and random sampling to reach conclusions with the last resource in a 25-part series. The assessment contains three scenarios, each with several parts, and covers comparing populations using random...
EngageNY
Using Sample Data to Compare the Means of Two or More Populations II
The 23rd segment in a series of 25 presents random samples from two populations to determine whether there is a difference. Groups determine whether they believe there is a difference between the two populations and later use an...
EngageNY
Estimating a Population Proportion
Find the percent of middle schoolers who want the ability to freeze time. The 21st installment in a series of 25 has groups collect a random sample of respondents who answer a question about superpowers. Using sample statistics,...
EngageNY
Sampling Variability and the Effect of Sample Size
The 19th installment in a 25-part series builds upon the sampling from the previous unit and takes a larger sample. Pupils compare the dot plots of sample means using two different sample sizes to find which one has the better variability.
EngageNY
Random Sampling
Sample pennies to gain an understanding of their ages. The 16th installment of a 25-part series requires groups to collect samples from a jar of pennies. Pupils compare the distribution of their samples with the distribution of the...
EngageNY
Mid-Module Assessment Task: Grade 7 Mathematics Module 5
Determine the probability that the class knows probability. The three-question assessment presents problems with finding the sample space and the probability, theoretical and experimental, of a variety of situations. Pupils also describe...
EngageNY
Conducting a Simulation to Estimate the Probability of an Event
How can you complete a simulation when it is not practical to determine the probability of an event? Class members learn that in some situations, it is not feasible to find the probability of an event, but they can estimate it by running...
EngageNY
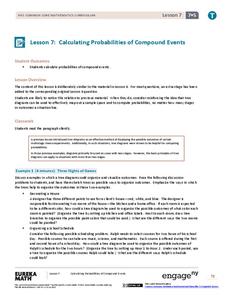
Calculating Probabilities of Compound Events
Use tree diagrams with multiple branches to calculate the probabilities of compound events. Pupils use tree diagrams to find the sample space for probability problems and use them to determine the probability of compound events in the...
EngageNY
Calculating Probabilities for Chance Experiments with Equally Likely Outcomes
Calculate theoretical probabilities and compare them to experimental probabilities. Pupils build on their knowledge of experimental probabilities to determine theoretical probabilities. Participants work several problems with the...
EngageNY
Estimating Probabilities by Collecting Data
Take a spin to determine experimental probability. Small groups spin a spinner and keep track of the sums of the spins and calculate the resulting probabilities. Pupils use simulated frequencies to practice finding other probabilities to...
College Board
AP United States History Practice Exam
Looking for a practice set for the AP United States History exam? The packet for the 2015 exam provides just such an opportunity. Included in the resource are the same instructions, question types, and timing guides used in the May exams.
EngageNY
Mid-Module Assessment Task: Grade 7 Mathematics Module 3
Lesson 16 in the series of 28 is a mid-module assessment. Learners simplify expressions, write and solve equations, and write and solve inequalities. Most questions begin as word problems adding a critical thinking component to the...
EngageNY
Mixture Problems
What percent of the mixture is juice? Pairs use their knowledge of proportions to determine what percent a mixture is juice given the percent of juice in the components. Pupils use the procedure learned with the juice mixture problem to...
EngageNY
Changing Scales
Pupils determine scale factors from one figure to another and the scale factor in the reverse direction. Scholars compute the percent changes between three figures.


