Curated OER
What a View!
Students examine two- and three-dimensional shapes and figures. Individually, they practice identifying the shape from various viewpoints. By completing this activity, they develop a spatial sense about how figures and shapes are...
Curated OER
As Good As Gold
Students find examples of the Golden Ratio on the human body through measurement. Additionally, students learn about the use of the Golden Ratio and the Golden Rectangle in art and architecture. A very interesting lesson for the students!
Curated OER
Fractions and Panes
Students recognize the fractional values of window panes as part of the whole window. In this window panes lesson, students listen to a story about window panes and sing a song. Students look at pictures of windows and write fractions...
Curated OER
West Nile Virus and Lyme Disease: Making Sense of the Numbers
In an interdisciplinary exploration, trace the development of West Nile fever and Lyme diseases. Pupils discover how these diseases are contracted. They collect statistical data and analyze trends.
Curated OER
Exquisite Excursions
Young scholars locate 6 cities, one on each of the 6 major continents. They find distance for each leg of their journey, convert to percents, use a time zone map, and convert to foreign currencies.
University of Waterloo
Rounding and Estimating 1: Introduction
Pupils practice mental math skills in math drills. They play the online interactive game "Rounding Off" to practice rounding off different numbers. Afterward, they complete a paper based follow up exercise for reinforcement.
Curated OER
Leadership Program in Discrete Mathematics
Students, using Pascal's triangle, find the number of items given each day in the song, "The 12 Days of Christmas."
Curated OER
Code Cracking
There is nothing more engaging than cracking a secret code! Middle schoolers will replace letters with numbers to solve problems. This game will help them to begin to understand algebra questions by finding the value of missing numbers....
American Statistical Association
Tell it Like it is!
Scholars apply prior knowledge of statistics to write a conclusion. They summarize using correct academic language and tell the story of the data.
Teach Engineering
Air Pressure
Investigate what is pushing on us. An intriguing lesson has pupils calculate the amount of force on various squares due to air pressure. Using the data, individuals create a graph in the third lesson of the Up, Up and Away unit...
National Autistic Society
Autism Awareness
Planning activities for Autism Awareness Month? Check out the ideas in a packet designed to raise awareness of autism. Suggestions include plans for an assembly to launch a school-wide focus, lesson plans for classroom activities,...
Baylor College
Calculating Exponential Growth
There can be a steep learning curve when teaching about exponential growth, but the lesson helps kids make sense out of the concept. When talking about exponential growth of viruses, learners may not be very interested, but when you are...
Curated OER
Election Poll, Variation 2
When a random sample isn't enough, your math class can compare the data from a physical simulation to decide if the probability is still likely. The lesson is part of a probability series that focuses on one question and different ways...
Curated OER
Liquid Killer
Students explore number sense applications and discuss strategies for multiplication and division using mental math. For cross-curricular purposes, they explore causes and effects of inequality and social injustice. Students explore...
Pennsylvania Department of Education
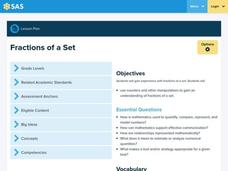
Fractions of a Set
Students explore number sense by completing a number set worksheet. In this fractions lesson, students utilize pattern blocks as a visual reference to the fractions they practice identifying. Students read the book Clean-Sweep Campers...
Curated OER
Hearing
Students explore how the sense of hearing helps us learn from each other through communication. Sound can produce patterns.
Curated OER
Volume and Surface Area: Which Is More?
Learners explore the volume and surface area of three dimensional figures. Through the use of video, students discover three dimensional shapes, their uses in real-life applications, and methods used to calculate their volume and surface...
Curated OER
Secret Agent Stan
Young scholars answer time and money questions to solve a mystery. For this time and money lesson, students act as detectives to find Secret Agent Stan's identification number by answering questions from his logbook involving elapsed...
Curated OER
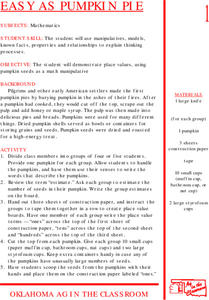
EASY AS PUMPKIN PIE
Students demonstrate place values using pumpkin seeds as a math manipulative. They use manipulatives, models, known facts, properties and relationships to explain thinking processes. They estimate the number of seeds in their pumpkin.
Curated OER
Explore the Ocean
Learners explore the oceans from their origin. In this oceans lesson plan, students read and discuss excerpts from the Book of Genesis regarding the creation of the ocean. Learners then clean up a mock oil spill, measure the volume and...
Curated OER
Introduction to Fractals: Geometric Fractals
Learners study and observe the patterns made by the areas of the Sierpinski Triangle. Students use the computer to draw two or three iterations to discover the number patterns. Learners complete worksheets based on Geometric Fractals.
American Statistical Association
EllipSeeIt: Visualizing Strength and Direction of Correlation
Seeing is believing. Given several bivariate data sets, learners make scatter plots using the online SeeIt program to visualize the correlation. To get a more complete picture of the topic, they research their own data set and perform an...
Teach Engineering
Exploring Energy: Kinetic and Potential
The potential of the energy in the class is moving. The third segment in a six-part unit on energy provides a deeper understanding of kinetic and potential energy. Learners understand the relationship between mass, speed, and energy and...
American Statistical Association
Scatter It! (Using Census Results to Help Predict Melissa’s Height)
Pupils use the provided census data to guess the future height of a child. They organize and plot the data, solve for the line of best fit, and determine the likely height and range for a specific age.
