Illustrative Mathematics
Voting for Three, Variation 3
Get your learners to think outside the box. Students require a good understanding of ratios and their relationship to fractions to complete the problem. The only quantities given in the problem are the ratio of the number of votes for...
Illustrative Mathematics
Voting for Three, Variation 1
This is an opportunity for young mathematicians to apply reasoning to solve real-world problems with ratios. Even though there are three candidates for class president, students will only consider two at a time, making the first problem...
Curated OER
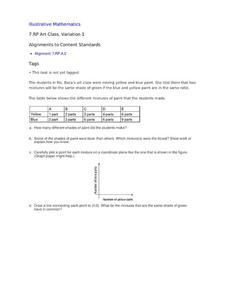
Art Class, Variation 1
Student statisticians calculate ratios to determine how many shades of green were mixed by Ms. Baca's art class. They graph the number of blue parts against the number of yellow parts for each combination and discover that some produce...
Curated OER
Stock Swaps, Variation 3
More on the fictitious takeover of the Apple Corporation by Microsoft. For this scenario, Microsoft has $28.00 per share to spare, so how many do they need to offer to make an even trade? This is an engaging problem to solve when...
Curated OER
Stock Swaps, Variation 2
If Microsoft wanted to take over Apple, how many shares would they need to break even? This is an ideal task for seventh graders who are studying proportional relationships and applying them to real-world scenarios. Use it as an...
Illustrative Mathematics
Finding Areas of Polygons, Variation 1
An exercise in finding the area of polygons by decomposing into triangles and composing into rectangles is the focus of this resource. Make several copies of the worksheet for each participant. Ask learners to use colored pencils to...
Illustrative Mathematics
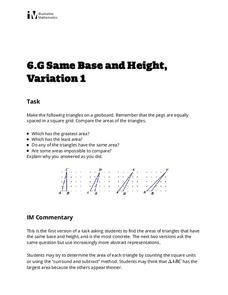
Same Base and Height, Variation 1
Four triangles are depicted for learners to construct on a geoboard. They compute and compare the areas, and so meet one of the sixth grade Common Core standards for geometry. Note that the set of triangles does not include a right...
Curated OER
Election Poll, Variation 2
When a random sample isn't enough, your math class can compare the data from a physical simulation to decide if the probability is still likely. The lesson is part of a probability series that focuses on one question and different ways...
Curated OER
Winter-time Temps
Young scholars measure temperature and become aware the the temperature above and below the snow is different. In this winter temperature lesson, students measure temperatures to find variation based on how the snow is packed. Young...
Mixing In Math
Mixing in Math: Growing Plants
Whether you have your class plant seeds or begin when sprouts are visible, math skills are used here to predict and track growth over time. Straw bar graphs show plant height on a given day while the graph as a whole shows changes over...
101 Questions
Slow Church
The church that just can't stay put! A video presentation raises questions of just how far the church will move. Presented with the rate of movement and a range of time expected, scholars build an inequality to answer the question.
American Statistical Association
How Fast Are You?
Quick! Snap up the lesson. Scholars first use an online app to collect data on reaction times by clicking a button when the color of a box changes. They then plot and analyze the data by considering measures of center, measures of...
Curated OER
Human Genetics-- Class Tally: Do You Have a Hitchhiker's Thumb?
In this science worksheet, students study diversity in human genetics by participating in a class survey and generating a tally graph. Students are asked if they have a "hitchhiker's thumb" and the results are displayed on the tally...
Noyce Foundation
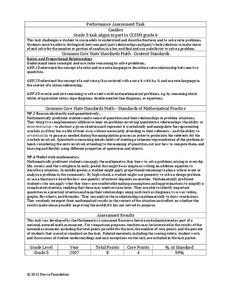
Candy Fractions
While examining fractions and ratios, your leaners get to read about one of their favorite subjects: candy! There are four word problems on this worksheet. Learners consider situations in which "for every x caramels there are y...
Illustrative Mathematics
Molly's Run
A simple lesson with a lot of support behind it. Your learners will find out how long it takes Molly to run a mile by choosing their solution method. The activity can be used as a lesson or as an independent assignment. Preface with...
Curriculum Corner
St. Patrick's Day Decimal Game
What better way to compare decimals than in a St. Patrick's Day themed game. Here, young leprechauns choose two cards from a stack, record the decimals on the provided worksheet, and compare them by using >, <, or =. Variate the...
Curated OER
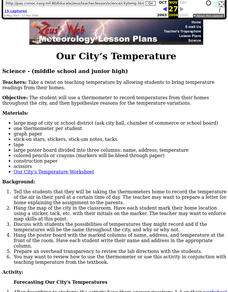
Our City's Temperature
Students use a thermometer to record temperatures from their homes throughout the city, and then hypothesize reasons for the temperature variations. They use a weather graph worksheet that's imbedded in this lesson to orgainize their data.
Curated OER
Canada's Climate: Temperature and Rainfall Variations
Middle schoolers analyze data about various climates in Canada. In this data analysis and climate instructional activity, students use Canada Year Book 1999 to complete a worksheet and make connections between precipitation and...
Del Mar College
Formulas for Elementary and Intermediate Algebra
Give your scholars the support they need to work with formulas. A reference page offers definitions and picture examples of perimeter, area, surface area, volume, the Pythagorean theorem, a variety of shapes, and more.
University of Colorado
Punnett Squares with Piebald Deer
Explore the science behind Earth's amazing diversity of life with this lesson plan on genetics. Looking at specific traits in piebald deer, carnations, and roan cattle, young scientists use Punnett squares to determine the possible...
101 Questions
Gas Station Ripoff
Ever wonder if you can trust the pump that pumps your gas? Budding mathematicians use video evidence to analyze the cost-per-gallon ratio at different intervals for three different pumps. Their goal is to identify the pump that is...
101 Questions
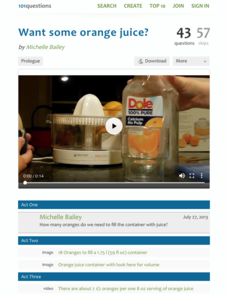
Want Some Orange Juice?
Juice up your lessons with an open-ended resource. Scholars must determine how many oranges it takes to fill a container with juice. They use information presented in a video and as images to find the solution.
PBS
Scale City — Inverse Proportions and Shadows in the Real World
Bring the resource out from the shadows. Viewers of a short video learn about drive-in theaters and how operators project images onto a large screen. They then perform an experiment to determine the relationship between the distance of...
Corbett Maths
Direct Proportion
Direct change by finding the constant. Using two known values within a direct proportion, the resource shows how to find the constant of proportionality. Once individuals do that, they then find any value given the other. The video works...
Other popular searches
- Direct Variation
- Inverse Variation
- Genetic Variation
- Genetic Diversity
- Direct Variation in Algebra
- Direct and Inverse Variation
- Constant of Variation
- Direct Variation in Graphs
- Human Genetic Variation
- Direct Variation in Math
- Direct Variation and Graphs
- Climatic Variations


