Curated OER
How Many Blades of Grass in a Football Field?
Learners, by taking a sample count from a small area, estimate the total number of blades of grass in a football field. They use a cardboard from, the inside of which measures 1 square foot to do their calculations.
EngageNY
Estimating a Population Proportion
Find the percent of middle schoolers who want the ability to freeze time. The 21st installment in a series of 25 has groups collect a random sample of respondents who answer a question about superpowers. Using sample statistics,...
EngageNY
End-of-Module Assessment Task: Grade 7 Mathematics Module 5
Show learners how to use simulations and random sampling to reach conclusions with the last resource in a 25-part series. The assessment contains three scenarios, each with several parts, and covers comparing populations using random...
Bowland
Public Transport
"Statistics is the grammar of science" -Karl Pearson. In the assessment task, learners read a claim made by a newspaper and analyze its conclusions. They need to think about the sample and the wording of the given statistics.
Project Maths
Probability and Relative Frequency
It's all relatively simple once you get the gist. Young mathematicians learn about sample spaces and simple probability by conducting an activity with dice. To complete the second of six parts in the Statistics and Probability unit, they...
Bowland
Counting Trees
Let's find a way to determine how many there are. Given a diagram of trees on a plantation, pupils devise a way to estimate the number of old and new trees. Using their methods, learners create estimates for the number of the two types...
Biology Corner
Random Sampling
Simulate a random sampling of data by tearing 20 sheets of paper into slips and place a number on 10 and a letter on 10. They place the slips in two separate containers and randomly draw a number and a letter. They record their...
Houghton Mifflin Harcourt
Random Samples: Estimating Population
With this estimating populations assignment, your class will learn about taking random population samples and calculating the average number of species in the samples to estimate the total population. Students use the given data to find...
Curated OER
Making a Circle Graph of a Sample Budget
Students examine a sample budget and categorize the entries as a group. Then in small groups they convert budget category totals to percents and degrees to make a circle graph related to a sample budget.
Curated OER
Data Analysis Using Technology
Analyze data using technology. Middle schoolers design data investigations, describe data, and draw their own conclusions. Then they select the best type of graph, graph and interpret the data, and look for patterns in trends. They also...
Curated OER
College Athletes
When more basketball players are taller than field hockey players at a school, is it safe to say that in general they are always taller? The activity takes data from two college teams and your learners will be able to answer questions...
Classrooms in Action
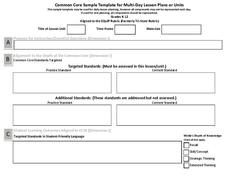
Common Core Sample Template for Multi-Day Lesson Plans or Units
Make sure you've covered all your bases when designing a Common Core unit. From essential questions and standards alignment to instructional supports and reflections, this template will guide you toward completing a comprehensive,...
CCSS Math Activities
Smarter Balanced Sample Items: 7th Grade Math – Target I
The probability is high that these questions will challenge your pupils! The ninth and final installment of the Grade 7 Claim 1 Slideshow series, a set of items assesses the understanding of simple and compound probability concepts....
CCSS Math Activities
Smarter Balanced Sample Items: 7th Grade Math – Target H
Not one but two box plots. How will your pupils fare? Assess their understanding of box plots by having them compare two populations. The eighth of nine installments in the Gr. 7 Claim 1 Item Slide Shows series, the resource has them...
CCSS Math Activities
Smarter Balanced Sample Items: 7th Grade Math – Target E
How well do your classes understand scale? You'll certainly know after they answer the set of eight questions from an informative and helpful presentation. Questions include items from coordinate geometry, similar triangles, and scale...
CCSS Math Activities
Smarter Balanced Sample Items: 7th Grade Math – Target D
Put expressions, equations, and inequalities to work! Young scholars solve problems using various strategies. Meant as a snapshot of the Smarter Balanced Assessment, a set of seven questions includes topics from writing expressions to...
CCSS Math Activities
Smarter Balanced Sample Items: 7th Grade Math – Target A
How do you know if your pupils have a deep understanding of proportional relationships? Assessment is key! A helpful series starts with questions on proportional relationships modeled after the Smarter Balanced Assessment items....
CCSS Math Activities
Smarter Balanced Sample Items: 7th Grade Math – Target B
Fraction and integer operations follow the same rules. Assess the depth of understanding with operations with rational numbers using a presentation from the Grade 7 Claim 1 Slideshow series. A set of slides presents 12 question and...
CCSS Math Activities
Smarter Balanced Sample Items: 7th Grade Math – Target F
Sometimes it's how you ask the question that counts. The sixth installment of nine from the Smarter Balanced Claim 1 Slideshow series presents a set of 13 questions to assess understanding of angle relationships as well as area and...
CCSS Math Activities
Smarter Balanced Sample Items: 7th Grade Math – Claim 2
To solve or not to solve that is the problem. A slide presentation of 17 items show different ways that Smarter Balanced assesses Claim 2, problem solving. The items span from sixth and seventh grade concepts to highlight the...
Bowland
Ice Cream
Make sure there is enough ice cream on hand. Learners try to find out how much ice cream to buy for a sports event. Scholars use a pie chart showing the percent of a sample of people who like different flavors of ice cream. Using the...
Curated OER
Assessing the quality of habitat for Monarch Butterflies
Students use different sampling methods to determine the population size and appropriate space for monarch butterflies. For this averages lesson plan, students complete word problems where they can accurately estimate the size of an...
Curated OER
Drawing One and Two Playing Cards With Replacement
Math whizzes use data from simulations to make theoretical generalizations and discuss possible relationships between several given events. They use a simple card game to generate data to be analyzed.
Curated OER
Statistics
Seventh and eighth graders solve and complete three various types of problems. First, they find the median rate using the box-and-whisker plot shown. Then, learners describe the inter-quartile range. In addition, they determine whether...
Other popular searches
- Descriptive Writing Samples
- Memoir Samples
- Rock and Soil Samples
- Persuasive Text Samples
- Samples of Editorials
- Oral Reading Fluency Samples
- Dna Samples
- Bad Grammar Samples
- Explanatory Writing Samples
- Samples of Anecdotes
- 5 Paragraph Essay Samples
- Narrative Paragraph Samples


