Shodor Education Foundation
Spinner
Go round and round to compare theoretical and experimental probabilities. Learners set the number of sectors and the number of spins for a spinner. Then, a table displays the experimental and theoretical probabilities of the spinner for...
Shodor Education Foundation
Marbles
Grab some marbles from a bag. The applet simulates drawing marbles from a bag. Pupils determine the number of four colors of marbles in a bag and how many marbles to draw. Using information on whether order matters in the draw and if...
Shodor Education Foundation
Plop It!
Build upon and stack up data to get the complete picture. Using the applet, pupils build bar graphs. As the bar graph builds, the interactive graphically displays the mean, median, and mode. Learners finish by exploring the changes in...
Shodor Education Foundation
Measures
Take a look at data from a statistical lens. An interactive allows pupils to enter data set, labeling the data including the units used. Manipulating the applet, learners select the statistics to calculate that include total, mean,...
Shodor Education Foundation
Ordered Simple Plot
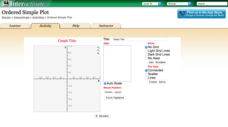
Open your imagination to make algebra-inspired creations. An interactive lesson has scholars graph images from a set of parameters. Users can practice minimum values, maximum values, and scale as well as key features.
Curated OER
Our Disastrous World
Students explore natural disasters around the world from the experiences of other students, friends and families. They collaborate with countries such as Japan, China, India, Australia, Russia, Great Britain as well as from the United...
Curated OER
Dino-Myte Spreadsheet
Do your learners like dinosaurs and theme parks? An ambitious lesson invites learners to put together a plan for supplying dinosaurs for a new theme park. Pupils work together in groups to come up with their plan, which must include a...
Curated OER
When A Car Coughs. . .
Budding scientists collect and compare particulate exhaust from four different vehicles. They discuss how cars contribute to air quality. To get the most mileage out of this resource, have learners complete the optional step 5, in which...
Curated OER
Life on Mars
Young scholars research the feasibility of life on Mars and debate what it would need in order to sustain life. They work in teams to predict, research, infer, and explain their theory using models they build.
Curated OER
Broken-Heart Matching Game
Learners use this fun game to practice, reinforce, or apply a wide variety of skills around Valentine's Day. Each students receives half a heart with zig-zag cuts made of pink construction paper with a piece of information. Their job is...
Curated OER
TE Activity: Bubbling Plants
Young scholars study a way to quantify the process of photosynthesis during a given time using the Elodea plant. They design a hypothesis that they test in the hands on activity. They compare the amounts of photosynthesis that occur...
Curated OER
Strum Along
Students engage in a instructional activity which takes something constructed by the class, that would be normally classified as just sound, then work together to make what can be perceived to be music. Students construct a basic...
Curated OER
From Curiosity Cabinet to Museum Collection
Students study binomial nomenclature and museum-based research. They create a curiosity box, label the objects in their curiosity box , develop a classification scheme for the objects, and create a database of all objects collected by...
Curated OER
Wildflower Beautification Project
Students, in cooperative groups, design and create a wildflower garden for the community. They write letters to property owners requesting use of their land and then write invitations to their parents and to local, state, and federal...
Curated OER
What's in a Graph?
How many yellow Skittles® come in a fun-size package? Use candy color data to construct a bar graph and a pie chart. Pupils analyze bar graphs of real-life data on the Texas and Massachusetts populations. As an assessment at the end...
Curated OER
Weather or Not!
Seventh graders discuss weather. In this meteorology lesson, 7th graders view a movie on weather and take a quiz. They work in groups to make weather tools for a class weather station.
Curated OER
Take a Stab!
Your geology class practices taking core samples of a potato to examine the stratigraphy. This is a terrific modeling lesson that helps youngsters visualize strata that cannot be seen from the surface of the ground. The directions...
Teach Engineering
Alloy the Way to Mars
Future engineers test different alloys to determine the specific strength of each one. Based on the results, they make a recommendation to NASA on which alloy to use on engines for spacecraft.
Shodor Education Foundation
Algebra Quiz
Reviewing the process of solving equations is as easy as one click of a button. Scholars solve linear and quadratic equations by using a helpful interactive. The computer app automatically scores responses, providing immediate feedback...
Shodor Education Foundation
Algebra Four
Everybody wins when you play Algebra Four. Players solve linear and quadratic equations to earn pieces on the Algebra Four game. Make a row of four pieces and you win the game. But everyone gets practice with solving equations, so really...
Shodor Education Foundation
Data Flyer
Fit functions to data by using an interactive app. Individuals plot a scatter plot and then fit lines of best fit and regression curves to the data. The use of an app gives learners the opportunity to try out different functions to see...
Shodor Education Foundation
Linear Function Machine
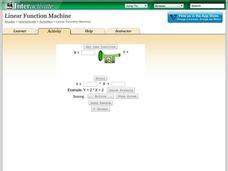
What goes in must come out! Learners play with a function machine to determine the correct function. They enter input values and watch as the machine produces the output.
Shodor Education Foundation
Incline
Study velocity while examining graphical representations. As scholars work with the animation, they discover the effect the height of an incline has on the velocity of the biker. They make conclusions about the slope of the...
Shodor Education Foundation
Graphit
No graphing calculator? No worries, there's an app for that! Young mathematicians use an app to graph functions. In addition, they can also plot data points.
Other popular searches
- Math and Science
- Math and Science Careers
- Integrated Math and Science
- Science/ Math Games
- Math and Science Activities
- Integrating Math and Science
- +Math and Science Careers
- Math and Science Plan
- Math in Science
- Math Science
- Math and Science Lessons
- Math and Forensic Science


