Curated OER
Identifying Linear Functions from Graphs
Keep your mathematicians engaged using this group linear functions activity. Each of ten groups receives two graphs with both an image and equation, as well as a "who has" phrase to call out the next graph. Scholars stay on their toes as...
Curated OER
Algebra I: Linear Functions
Using rates from a rental car company, young mathematicians graph data, explore linear relationships, and discuss the role of slope and the y-intercept. This instructional activity allows for the discussion of independent and dependent...
EngageNY
Nonlinear Models in a Data Context
How well does your garden grow? Model the growth of dahlias with nonlinear functions. In the instructional activity, scholars build on their understanding of mathematical models with nonlinear models. They look at dahlias growing in...
EngageNY
Graphs of Linear Functions and Rate of Change
Discover an important property of linear functions. Learners use the slope formula to calculate the rates of change of linear functions. They find that linear functions have constant rates of change and use this property to determine if...
Shodor Education Foundation
Linear Function Machine
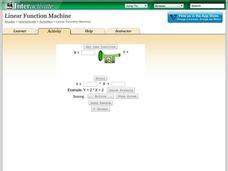
What goes in must come out! Learners play with a function machine to determine the correct function. They enter input values and watch as the machine produces the output.
Curated OER
Using Data Analysis to Review Linear Functions
Using either data provided or data that has been collected, young mathematicians graph linear functions to best fit their scatterplot. They also analyze their data and make predicitons based on the data. This lesson plan is intended as a...
University of Utah
Functions
Define, explore, compare, and analyze functions with the fourth chapter of a 10-part eighth-grade workbook series. After encountering the definition of a function, pupils begin to explore linear and nonlinear functions. They then work...
University of Utah
Explore Proportional and Linear Relationships
Progress from proportional relationships to linear functions. Pupils first review concepts of proportionality covered in earlier grades. They then extend these concepts to linear functions, such as determining the slope of a line using...
Texas Instruments
Is It or Isn't It Proportional
How can you tell if number relationships are proportional? Mathematicians investigate proportional relationships. They compare and contrast functions and graphs to determine the characteristics of proportional relationships, as well as...
Curated OER
US Airports, Assessment Variation
Determining relationships is all part of algebra and functions. Your mathematicians will decide the type of relationship between airports and population and translate what the slope and y-intercept represent. The problem is multiple...
Curated OER
Graphs and Functions
Middle schoolers describe plotting functions on the Cartesian coordinate plane. They solve functions on paper and using an online tool to plot points on a Cartesian coordinate plane creating lines and parabolas.
EngageNY
Nonlinear Motion
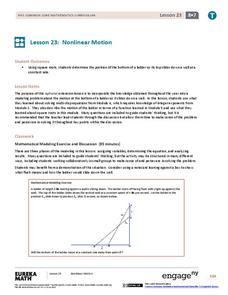
Investigate nonlinear motion through an analysis using the Pythagorean Theorem. Pupils combine their algebraic and geometric skills in the 24th lesson plan of this 25-part module. Using the Pythagorean Theorem, scholars collect data on...
Curated OER
Introduction to Functions
Students explore functions, function rules, and data tables. They explore terms of linear functions. Students use computers to analyze the functions. Students write short sentences to explain data tables and simple algebraic expressions.
Curated OER
What's My Rule? Simple Linear Functions
Students investigate simple linear functions by trying to guess a function rule from inputs and outputs. They write the function rule in algebraic form.
Mathalicious
Domino Effect
Carryout the lesson to determine the cost of pizza toppings from a Domino's Pizza® website while creating a linear model. Learners look through real data—and even create their own pizza—to determine the cost of each topping. They explore...
Illustrative Mathematics
Velocity vs. Distance
At the end of this activity, your number crunchers will have a better understanding as to how to describe graphs of velocity versus time and distance versus time. It is easy for learners to misinterpret graphs of velocity, so have them...
Curated OER
Products of Linear Functions
Students investigate the horizontal intercepts of functions. In this algebra lesson, students identify whether the factor of two functions results in a quadratic equation or not. They compare and contrast linear equations and higher...
Curated OER
Iterating Linear Functions
Students use a spreadsheet to investigate data. In this algebra lesson plan, students collect and graph data on a coordinate plane. They explain properties of a linear equation both algebraically and orally.
Curated OER
Graphing and Interpreting Linear Equations in Two Variables
Graph linear equations using a table of values. Learners solve equations in two variables using standard form of an equation. They identify the relationship between x and y values.
University of Utah
Representations of a Line
Line up to learn about lines! Scholars discover how to express patterns as linear functions. The workbook then covers how to graph and write linear equations in slope-intercept form, as well as how to write equations of parallel and...
Curated OER
Linear Regression and Correlation
Learners explore scatter plots. In this linear regression lesson, groups of pupils graph scatter plots and then find the line of best fit. They identify outliers and explain the correlation. Each group summarizes and shares their...
Saxon
Plotting Functions
Youngsters use a graphing calculator to assist in creating a function table. They graph the function on a coordinate plane. They explore the relationship between the domain and range in the graph. This four-page worksheet contains two...
Curated OER
Race Car Activity
Students investigate linear functions. In this linear functions instructional activity, students are given a situation where two race cars start at the same point. Students have four graphs that they match to the race car scenario. ...
Virginia Department of Education
Graphing Linear Equations
Combine linear equations and a little creativity to produce a work of art. Math scholars create a design as they graph a list of linear equations. Their project results in a stained glass window pattern that they color.


