Concord Consortium
Function Project
What if a coordinate plane becomes a slope-intercept plane? What does the graph of a linear function look like? Learners explore these questions by graphing the y-intercept of a linear equation as a function of its slope. The result is a...
EngageNY
Interpreting Quadratic Functions from Graphs and Tables
Seeing functions in nature is a beautiful part of mathematics by analyzing the motion of a dolphin over time. Then take a look at the value of a stock and maximize the profit of a new toy. Explore the application of quadratics by...
Curated OER
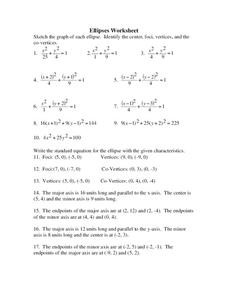
Ellipses
In this ellipses worksheet, students solve and complete 30 various types of problems that include determining the characteristics of ellipses. First, they draw the graph for each ellipse, labeling the center, foci, vertices, and...
Curated OER
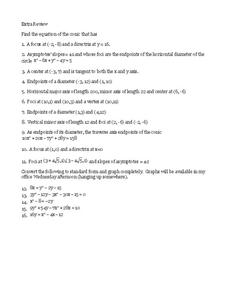
Conics
In this conic sections activity, 11th graders solve and complete 16 different types of equations. First, they find the equation of the conic that has a given focus and directrix. Then, students convert each given polynomial to standard...
Curated OER
LAND USE ISSUES
Students relate math with real life situations. They identify and plot points on a grid map. They identify and locate the Drop Box Sites.
Curated OER
Congruence Statements
In this congruence statements learning exercise, 10th graders solve and complete 16 various types of problems. First, they complete each congruence statement listed. Then, students graph each set of points on the coordinate plane...
Curated OER
Calculus Review
In this calculus worksheet, students figure out the volume of an area under the curve rotated about the x and y axis. There are 2 questions on this worksheet with various sub-section.
Curated OER
The Proof
Students will construct simple curves on graph paper by connecting a series of points between the vertical and horizontal axes. They share their designs and explain the patterns.
Curated OER
Graphs, Three-Dimensional Coordinates
In this three-dimensional graphing worksheet students identify the coordinates of the vertex of shown figures. The first three shapes show all answers. The following 8 shapes are on coordinate dot paper, with all three axis shown and...
Curated OER
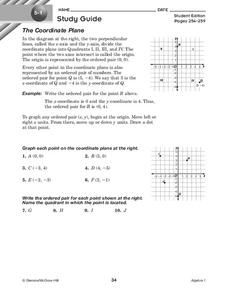
The Coordinate Plane
In this coordinate plane worksheet, 9th graders solve and complete 10 different problems that include graphing points on a plane. First, they graph each point on the coordinate plane shown. Then, students write the ordered pair for each...
Curated OER
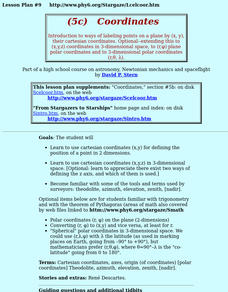
Coordinates
Young scholars use cartesian coordinates (x,y,z) in 3-dimensional space. [Optional: appreciate there exist two ways of defining the z axis, and which of them is used.] They become familiar with the tools and terms used by surveyors.
Curated OER
Trigonometry Review Sheet
Get the trig facts fast, and use the review sheet as a guide in the classroom. The worksheet also includes a document version if any changes are needed to the problems. The information includes a small degree/radian chart, a graph of all...
Mt. San Antonio Collage
Quadratic Functions and Their Graphs
Starting with the basics, learners discover the features of a parabola and the ways to accurately graph it. After pupils practice with graphing, the end of the activity focuses on application type problems.
Charleston School District
Analyzing Scatter Plots
Scatter plots tell a story about the data — you just need to be able to read it! Building from the previous lesson in the series where learners created scatter plots, they now learn how to find associations in those scatter plots. They...
Willow Tree
Histograms and Venn Diagrams
There are many different options for graphing data, which can be overwhelming even for experienced mathematcians. This time, the focus is on histograms and Venn diagrams that highlight the frequency of a range of data and overlap of...
CCSS Math Activities
Social Security Trust Fund
Will Social Security still be around when you retire? Given data on the predicted balance of the social security fund over time, scholars plot the points on a coordinate grid and determine if a quadratic regression fits the data. They...
Curated OER
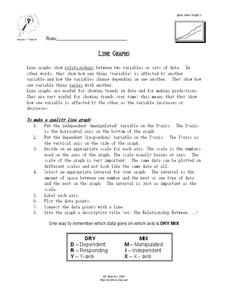
Line Graphs
In this algebra worksheet, students describe the relationship between a line graph and its data. They define the reasons line graphs are used and discuss increasing and decreasing lines. There is one involved questions, requiring several...
Curated OER
Scatter Plots
In this Algebra I/Geometry/Algebra II worksheet, students create a scatter plot and analyze the data to determine if the data show any type of correlation. The four page worksheet provides extensive explanation of topic, step-by-step...
Curated OER
Coordinates
In this geometry instructional activity, 10th graders are given points on a coordinate plane, and they must figure out what the x and y values are. There are 6 graphing question.
Curated OER
Mapping the Ocean Floor
Students construct and interpret a line graph of ocean floor depth and a bar graph comparing the height/depth of several well-known natural and man-made objects and places. In addition, they calculate the depth of two points using sonar...
Curated OER
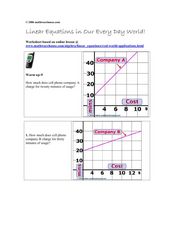
Linear Equations in Our Every Day World!
In this linear equations worksheet, high schoolers read and interpret graphed linear equations. They read a story problem, write a linear equation, and plot the points on a coordinate plane. This five-page worksheet cotnains 12 problems.
Curated OER
Trig and sine and cosine
For this trigonometric worksheet, students sketch given curves and calculate the area of the curve. They find the volume of solids. There are 3 questions.
Curated OER
Math Lesson: What Do You Want to Know? - Country Statistics
Young scholars are able to identify the characteristics of a variety of graphs (i.e. bar graph, line graph, pie graph, scatter plot, population pyramids, etc.) They recognize how the type of data to be presented plays a role in choosing...
Curated OER
Getting the Goods on Graphing
Students explore graphing. In this math lesson plan, students graph ordered pairs in the coordinate plane, write the coordinates of points shown on a plane, and create designs or pictures using ordered pairs.


