Curated OER
Dimensional Analysis
Twelfth graders examine different dimensions and units which go with a particular dimension. They explore the concept of linear measurement versus area. Students estimate area of 3-D objects. They practice converting from one unit of...
EngageNY
Interpreting Correlation
Is 0.56 stronger than -0.78? Interpret the correlation coefficient as the strength and direction of a linear relationship between two variables. An algebra lesson introduces the correlation coefficient by estimating and then calculating it.
EngageNY
Modeling with Polynomials—An Introduction (part 2)
Linear, quadratic, and now cubic functions can model real-life patterns. High schoolers create cubic regression equations to model different scenarios. They then use the regression equations to make predictions.
Institute of Electrical and Electronics Engineers
Rotational Equilibrium
Physics stars design mobiles that demonstrate rotational equilibrium. They take measurements and solve related equations for force by graphing, substitution, or determinants. This is a well-developed lesson plan, complete with student...
Curated OER
How Do They Relate? Linear Relationship
Students collect information and use a line to represent it. In this algebra instructional activity, students investigate real world data to see if it makes a line. They graph the line comparing the relationship of the x axis with that...
Curated OER
Beginning Modeling for Linear and Quadratic Data
Students create models to represent both linear and quadratic equations. In this algebra lesson, students collect data from the real world and analyze it. They graph and differentiate between the two types.
Curated OER
Comparison of Two Different Gender Sports Teams - Part 1 of 3 Measures of Central Tendency
Students gather and analyze data from sports teams. In this measures of central tendency lesson, students gather information from websites about sports team performance. Students analyze and draw conclusions from this data. This lesson...
Curated OER
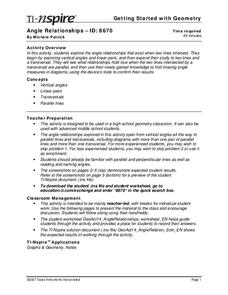
Angle Relationships
Tenth graders explore the angle relationships that exist when two lines intersect. In this geometry activity, 10th graders estimate the measure of given angles and use their graphing calculator tools. Students use this knowledge to find...
Key Curriculum Press
Triangle Inequalities
Properties about triangles are explored in this lesson. Geometers make conjectures about the length of a triangle's sides, the length of the angles in relation to the length of the sides, and the measure of the exterior angles of a...
Curated OER
Jumping to Solutions
Students explore two-step linear equations. In this middle school Pre-algebra lesson, students create and solve equations that describe how a person got to an end postion on a ruler by jumping. After physically creating the situation,...
Georgetown University
Cup-Activity: Writing Equations From Data
Determine how cup stacking relates to linear equations. Pupils stack cups and record the heights. Using the data collected, learners develop a linear equation that models the height. The scholars then interpret the slope and the...
Kenan Fellows
Density
Most scholars associate density with floating, but how do scientists determine the exact density of an unknown liquid? The third activity in a seven-part series challenges scholars to find the mass and volume of two unknown liquids. Each...
Teach Engineering
Light Intensity Lab
Let there be light. The last installment of a seven-part series has pupils conduct an experiment on light attenuation through different numbers of transparency sheets. They then relate the results back to how X-rays measure bone density.
Curated OER
Arc Length Lesson
Learners find the length of the arc of a circle. For this geometry lesson, students calculate the length of an arc and find the measure of the central angle given the length of the arc. They convert between linear and angular speed. They...
Curated OER
Slopes and Linear Equations
Students find the slopes of linear functions. In this graphing lesson, students analyze linear equations and calculate the slope of the line. They graph a line given the slope and y-intercept.
Curated OER
Cost Calculations Lesson Plan
Learners analyze data using graphs and equations. In this algebra instructional activity, students calculate the cost of lumber, convert price per foot to price per piece, solve equations using addition and subtraction and give exact...
Mathematics Assessment Project
Evaluating Statements About Enlargements
Double, toil ,and double linear dimensions. Learners first complete an assessment investigating how doubling linear dimensions affects the area of pizzas and the volume of popcorn containers. They then complete an activity investigating...
EngageNY
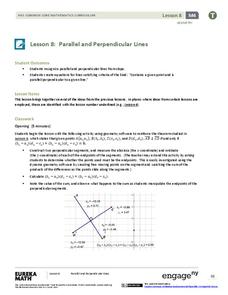
Parallel and Perpendicular Lines
Use what you know about parallel and perpendicular lines to write equations! Learners take an equation of a line and write an equation of a line that is parallel or perpendicular using slope criteria. They then solve problems to...
Curated OER
It's a Drag!
Students create number lines using decimals and whole numbers. In this algebra lesson, students graph and solve linear equations. They plot ordered pairs on a coordinate plane correctly.
Curated OER
Correlation of Variables by Graphing
Middle and high schoolers use a spreadsheet to graph data. In this graphing lesson, learners determine how two parameters are correlated. They create a scatter plot graph using a computer spreadsheet.
EngageNY
Two Graphing Stories
Can you graph your story? Keep your classes interested by challenging them to graph a scenario and interpret the meaning of an intersection. Be sure they paty attention to the detail of a graph, including intercepts, slope,...
Curated OER
The Fractal Coast
Students investigate measuring as it relates to the real world. In this geometry lesson, students measure distances as they discuss fractals and how it relates to measuring. They measure both linear and non-linear distances.
Curated OER
Let's Measure
Students discuss comparing the size of two different sets of blocks. They estimate the length of the long blocks by answering the following questions: How can you use the small blocks to find out?, and How many small blocks does it...
Curated OER
Rates in Linear Mechanical Systems
Students examine factors that control rates in mechanical system. They identify units associated with speed, calculate speed of moving object, identify units associated with acceleration, and calculate acceleration of moving object.


