Curated OER
Difference One Proton Makes
Chemsitry aces learn that protons are located in the nucleus and the number of protons in the nucleus determines the atomic number of an element. In this lesson, they compare materials made up of a single element and other materials...
Curated OER
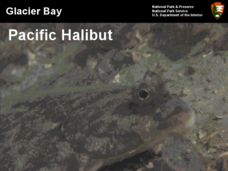
Glacier Bay Pacific Halibut
The National Park Service has produced a high-quality presentation on the halibut population of Glacier Bay, Alaska. It takes the viewpoint of the marine biologists or rather, ichthyologists, who have been studying the adaptations,...
Curated OER
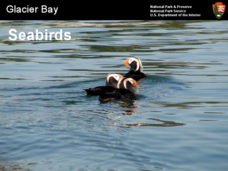
Glacier Bay Seabirds
A gorgeous collection of photographs take viewers on a virtual tour or Glacier Bay National Park with a focus on the seabirds living in the area. Adaptations to the polar climate are highlighted, different species of birds are displayed,...
Curated OER
Generating Hypotheses and Experimental Design 1
Here is a thorough exercise in forming hypotheses for scientific investigations. Young scientists consider factors that may be related to the question they would like to address. They think through measurable changes that may result from...
Curated OER
Does cloud type affect rainfall?
Student use MY NASA DATA to obtain precipitation and cloud type data. They create graphs of data within MY NASA DATA. Students compare different cloud types, compare precipitation, and cloud type data They qualitatively describe graphs...
Curated OER
Carbon Monoxide and Population Density
Tenth graders investigate the carbon monoxide level at a fixed latitude. They determine if there is a relationship to population density. They download data sets and generate a graph. They determine a link between human activity and...
Curated OER
How Much Water is Available in the Atmosphere for Precipitation?
Students explore the relationship between the amount of water in the atmosphere available for precipitation and the actual precipitation observed by satellite. They examine seasonal changes in precipitation. They practice using Internet...
Curated OER
Case Study of Local Trends in the Carbon Cycle
Students examine the relationship between chlorophyll and carbon dioxide in the atmosphere. For this investigative lesson students study the local effects of climate change.
Curated OER
The Fabled Maine Winter
Students graph and analyze scientific data. In this research instructional activity students use the Internet to obtain data then draw conclusions about what they found.
Curated OER
Radiation Comparison Before and After 9-11
Using the NASA website, class members try to determine if changes could be detected in cloud cover, temperature, and/or radiation measurements due to the lack of contrails that resulted from the halt in air traffic after the attacks of...
Curated OER
Ocean Impacts of an El Nino Event
Students study sea surface height and temperature and other characteristics of an El Nino. For this ocean impacts lesson students examine the factors that influence an El Nino or La Nina.
Curated OER
Hurricane Research
Students examine the factors that influence hurricanes to develop. In this hurricane instructional activity students research atmospheric trends that affect hurricanes and create a summary.
Curated OER
The Reason for the Seasons
Young scholars compare graphs of their data that was generated on a NASA website. In this seasons lesson students complete a lab activity.
Curated OER
Solar Cell Energy Availability From Around the Country
Students determine areas that are the most likely to produce solar energy by using NASA data. In this solar energy lesson students analyze plots and determine solar panel use.
Curated OER
Investigating Seasonal Variability in NO2 Concentrations
Students study different formats of data and determine the nitrogen dioxide concentrations. For this seasons lesson students understand the different relationships that NO2 can have.
Curated OER
A Comparison of Cloud Coverage over Africa
Students identify different climate regions and local weather patterns. In this cloud coverage lesson students use NASA satellite data and import it into Excel.
Curated OER
Think GREEN - Utilizing Renewable Solar Energy
Students use data to find the best renewable energy potential. In this solar energy lesson students import data into Excel and explain how solar energy is beneficial.
Curated OER
Identifying Ozone Variations over Different Locations
Students analyze ozone data. In this atmosphere lesson, students will use a NASA resource to gather data for different regions of the Earth. Students will then create a graph for their data and answer related questions.
Curated OER
Storm Clouds-- Fly over a Late Winter Storm onboard a NASA Earth Observing Satellite
Students study cloud data and weather maps to explore cloud activity. In this cloud data lesson students locate latitude and longitude coordinates and determine cloud cover percentages.
Curated OER
Is Portland, Oregon Experiencing Global Warming?
Students use data to determine if the climate in Portland has changed over the years. In this weather activity students complete line graphs and study long wave radiation.
Curated OER
Hurricanes As Heat Engines
Students examine sea surface temperatures to see how hurricanes get heat from the oceans surface. In this hurricanes lesson plan students use the Internet to find data and make line plots.
Curated OER
Dry Season and 'Green' Season in Costa Rica
Students explore the seasonal changes in Costa Rica. In this dry season instructional activity students use the Internet to locate science data then generate data for precipitation.
Curated OER
The Solstices
Compare surface temperatures when the solstice occurs in the different hemispheres. Young scientists draw conclusions from their investigation of data collected using spreadsheets and a globe.
Curated OER
Earth's Energy Budget - Seasonal Cycles in Net Radiative Flux
Students attempt to understand seasonal variation by viewing images of the energy received by the earth. In this weather lesson, students view images from NASA of the influx of energy from the sun and make predictions about resulting...


