Virginia Department of Education
Analyzing and Interpreting Statistics
Use measures of variance to compare and analyze data sets. Pupils match histograms of data sets to their respective statistical measures. They then use calculated statistics to further analyze groups of data and use the results to make...
Statistics Education Web
Types of Average Sampling: "Household Words" to Dwell On
Show your classes how different means can represent the same data. Individuals collect household size data and calculate the mean. Pupils learn how handling of the data influences the value of the mean.
Curated OER
Representing Data 1: Using Frequency Graphs
Here is a activity that focuses on the use of frequency graphs to identify a range of measures and makes sense of data in a real-world context as well as constructing frequency graphs given information about the mean, median, and range...
Curated OER
Representing Data 2: Using Box Plots
What information can be gleaned from a box and whiskers plot? Discuss the five summary values - minimum, maximum, upper and lower quartiles, and median - and what conclusions can be made from these values? Included here is a matching...
Howard Hughes Medical Institute
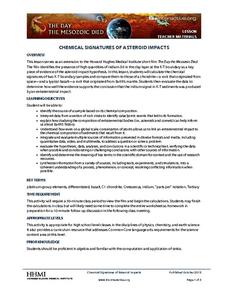
Chemical Signatures of Asteroid Impacts
What killed the dinosaurs and how do scientists know? Your high schoolers can examine these fascinating questions with a geochemical lens using the engaging 33-minute video, the accompanying data interpretation, and some thoughtful...
Mathematics Assessment Project
Representing Polynomials
Use this complete and very detailed lesson plan to assess your students' understanding of two important behaviors of polynomials. The first is the relationship between the zeros of a polynomial function and the function's graph, and the...
Curated OER
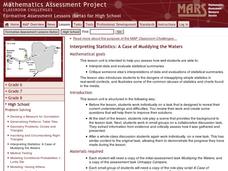
Interpreting Statistics: A Case of Muddying the Waters
Is river pollution affecting the number of visitors to Riverside Center, and is the factory built upstream the cause of the pollution? Let your class be the judge, literally, as they weigh the statistical evidence offered by the factory...
Jesuit High School
Geometry Sample Problems
I'd like to prove that this instructional activity has a lot to offer. Seven problems using triangles and parallelograms practice the traditional method of a two-column proof. After the instructional activity is some practice problems...
Statistics Education Web
10,000 Steps?
Conduct an experiment to determine the accuracy of pedometers versus pedometer apps. Class members collect data from each device, analyze the data using a hypothesis test, and determine if there is a significant difference between the...
Statistics Education Web
Text Messaging is Time Consuming! What Gives?
The more you text, the less you study. Have classes test this hypothesis or another question related to text messages. Using real data, learners use technology to create a scatter plot and calculate a regression line. They create a dot...
Statistics Education Web
Consuming Cola
Caffeine affects your heart rate — or does it? Learners study experimental design while conducting their own experiment. They collect heart rate data after drinking a caffeinated beverage, create a box plot, and draw conclusions. They...
Statistics Education Web
Saga of Survival (Using Data about Donner Party to Illustrate Descriptive Statistics)
What did gender have to do with the survival rates of the Donner Party? Using comparative box plots, classes compare the ages of the survivors and nonsurvivors. Using the same method, individuals make conclusions about the gender and...
Illustrative Mathematics
Foxes and Rabbits 3
Model periodic populations. Here, in the context of foxes and rabbits, pupils look at graphs of the populations of these animals in a national park over a span of 24 months. Groups analyze the graphs and determine trigonometric functions...
Illustrative Mathematics
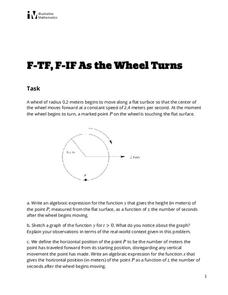
As the Wheel Turns
Determine the location of a point on a moving wheel. The task challenges groups to determine the horizontal and vertical locations of a point on the edge of wheel that is moving. Teams first determine a function that will model the...
Illustrative Mathematics
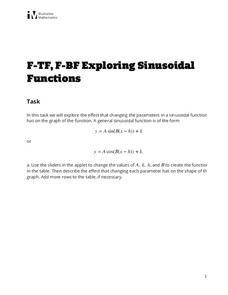
Exploring Sinusoidal Functions
What effect does changing a parameter have on the graph of a trigonometric function? Pupils use a Desmos applet to explore the general sine graph. They experiment changing different parameters and record the resulting change of the...
Virginia Department of Education
Similar Triangles
Pupils work in pairs to investigate what it takes to prove that two triangles are similar. They work through various shortcuts to find which are enough to show a similarity relationship between the triangles. Small groups work with the...
Virginia Department of Education
Linear Modeling
An inquiry-based algebra instructional activity explores real-world applications of linear functions. Scholars investigate four different situations that can be modeled by linear functions, identifying the rate of change, as well as the...
02 x 02 Worksheets
Symmetry
Get learners' minds rotating and reflecting while looking for symmetry. Pupils investigate figures to determine the number of lines of symmetry and if the figure has rotational symmetry. Classmates work together in groups to find out the...
Virginia Department of Education
Types of Variations
Scholars determine how two quantities vary with respect to each other. They complete a fill-in-the-blank activity by stating whether the entities vary directly, inversely, or jointly, create equations that match different variations, and...
Virginia Department of Education
Curve of Best Fit
Which function models the data best? Pupils work through several activities to model data with a variety of functions. Individuals begin by reviewing the shapes of the functions and finding functions that will fit plotted data points. By...
Illustrative Mathematics
Do Two Points Always Determine a Linear Function?
Your learners can approach this task algebraically, geometrically, or both. They analyze the building of a linear function given two points and expand the concrete approach to the abstract when they are asked to find the general form of...
Curated OER
Illegal Fish
Your young fishermen learn about exponential function growth by interpreting the pieces of the given equation within the context of numbers of fish in a lake.
NASA
Lights on the International Space Station
Groups explore illumination with NASA's Lighting Environment Test Facility (LETF) as a context. Using the TI-Nspire app, groups determine the lux equation that models their simulation. They then use the lux equation to solve problems...
Conneticut Department of Education
Personal Finance Project Resource Book
Balancing a budget, paying taxes, and buying a home may feel out of reach for your high schoolers, but in their adult years they will thank you for the early tips. A set of five lessons integrates applicable money math activities with...
Other popular searches
- History of Mathematics
- Discrete Mathematics
- Mathematics Line Symmetry
- Everyday Mathematics
- Montessori Mathematics
- Writing in Mathematics
- Mathematics Mode and Median
- Applied Mathematics
- Mathematics Times Tables
- Christmas Mathematics
- B Ed Mathematics
- Discrete Mathematics Graph


