Radford University
Modeling Statistical Data
Can people predict the number of future divorces? Scholars research and analyze data on the number of divorces and teenage pregnancies in Virginia over time. They use the data to create graphs, determine the best-fit equations, and make...
Center for Civic Education
The Power of Nonviolence: What Is Nonviolence? What Does It Cost?
Your young learners will delve into the language of primary source documents in order to identify the characteristics, benefits, and costs of nonviolence. The lesson includes a mix of activities, including an anticipatory activity,...
Radford University
Danger! – An Analysis of the Death Toll of Natural Disasters
Decipher the danger of natural disasters. Using researched data, scholars work in groups to create data displays on the number of deaths from different types of natural disasters. They share their graphical representations with the class...
National Museum of Mathematics
Hands-On Data Analysis
Jump at the chance to use this resource. A kinesthetic activity has classmates jumping in several different ways (standing, single-step, and multiple-step jumps) to create handprints on poster paper taped to the wall. They measure the...
Radford University
Data Analysis Activity
What do classmates think? In groups, learners design surveys to investigate chosen topics. They conduct the survey, then analyze the results. As part of the activity, they must calculate the mean, median, mode, variance, and standard...
Bonneville
Copper Oxide Cell Data Sharing
Sharing is caring—and good for learning, too. Learners share data from the experiment in the previous lesson by engaging in a gallery walk. They then consider and discuss the conditions under which a solar cell will have its maximum...
Bonneville
Titanium Dioxide Raspberry Solar Cell Data Sharing
Concerned about how well others did on the experiment? Scholars share results from the titanium dioxide raspberry solar cell test they performed in the previous lesson plan. After analyzing the data, they come up with a claim about the...
Anti-Defamation League
Analyzing Primary Source Documents to Understand U.S. Expansionism and 19th Century U.S.-Indian Relations
Historical events can be viewed from multiple perspectives. This simple truth is brought home in a lesson that examines primary source documents related to the Lewis and Clark Expedition, the Doctrine of Discovery and Manifest Destiny,...
Curated OER
Accidents Happen: Seat Belt Laws, Enforcement, and Usage
Start with a NOVA video about car crashes, crash test dummy footage, or other video about seat belt use. Or have groups review attached data about seat belt usage (by state) and share their conclusions. Learners then devise a method to...
Curated OER
Neighborhood or Slum? Snapshots of Five Points: 1827-1867
How has your local neighborhood changed throughout recent history? Young researchers evaluate census data, images, and primary source descriptions describing the living situation in the antebellum Five Points neighborhood. They consider...
NASA
Erosion and Landslides
A professional-quality PowerPoint, which includes links to footage of actual landslides in action, opens this moving lesson. Viewers learn what conditions lead to erosion and land giving way. They simulate landslides with a variety of...
Curated OER
Unlocking New Words: Partner Presentations
Following extensive modeling about how to apply word analysis and vocabulary skills to learn new words, partner teams create brief word presentations to teach new vocabulary to the class. Preselect words from upcoming social studies,...
Mathematics Assessment Project
Interpreting Distance–Time Graphs
Pre-algebra protégés critique a graph depicting Tom's trip to the bus stop. They work together to match descriptive cards to distance-time graph cards and data table cards, all of which are provided for you so you can make copies for...
C-SPAN
Historical Presidential Campaign Announcement Analysis
Using the announcements of presidential candidacies, pupils consider how contenders make their initial arguments to the public. A worksheet helps structure collaborative work to analyze 10 video clips. Writing prompts allow for extension...
EngageNY
Describing Distributions Using the Mean and MAD
What city has the most consistent temperatures? Pupils use the mean and mean absolute deviation to describe various data sets including the average temperature in several cities. The 10th lesson plan in the 22-part series asks learners...
Virginia Department of Education
Exploring Statistics
Collect and analyze data to find out something interesting about classmates. Groups devise a statistical question and collect data from their group members. Individuals then create a display of their data and calculate descriptive...
American Statistical Association
Don't Spill the Beans!
Become a bean counter. Pupils use a fun activity to design and execute an experiment to determine whether they can grab more beans with their dominant hand or non-dominant hand. They use the class data to create scatter plots and then...
EngageNY
Creating a Dot Plot
Which dot am I? Pupils create dot plots to represent sample data through the use of frequency tables. The third segment in a series of 22 asks individuals to analyze the dot plots they created. The scholars translate back and forth...
National Council of Teachers of Mathematics
Eruptions: Old Faithful Geyser
How long do we have to wait? Given several days of times between eruptions of Old Faithful, learners create a graphical representation for two days. Groups combine their data to determine an appropriate wait time between eruptions.
Beyond Benign
Municipal Waste Generation
Statistically, waste may become a problem in the future if people do not take action. Using their knowledge of statistics and data representation, pupils take a look at the idea of waste generation. The four-part unit has class members...
Howard Hughes Medical Institute
Lactase Persistence: Evidence for Selection
What's the link between lactase persistence and dairy farming? Biology scholars analyze data to find evidence of the connection, then relate this to human adaptation. Working individually and in small groups, learners view short video...
101 Questions
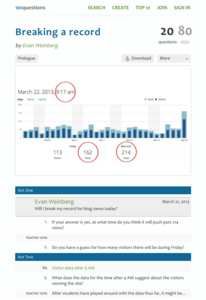
Breaking a Record
Can we break the record? Groups use provided data detailing the number of visitors to a blog to determine if the number of blog views breaks the previous record. They must take rates into consideration to make their estimates—a great...
Library of Congress
The Emancipation Proclamation and the Thirteenth Amendment
How did the Emancipation Proclamation lead to the Thirteenth Amendment? Middle schoolers analyze primary source documents including the text of the Emancipation Proclamation, political cartoons, photographs, and prints to understand the...
C-SPAN
Survey Analysis- Public Perceptions of Voting and Elections
The perception of fairness in elections becomes more important with each passing election. Using data from a C-SPAN poll, budding historians consider the differences between how people perceive elections. The resource includes videos of...
Other popular searches
- Data Analysis
- Literary Analysis
- Character Analysis
- Poetry Analysis
- Data
- Data, Census, & Statistics
- Character Sketch
- Word Analysis
- Analyzing Poetry
- Thinking Analysis
- Dimensional Analysis
- Analysis Song Lyrics


