Curated OER
Pi Day: The Other Math Holiday!
Happy Pi Day! This collection of games, experiments, and activities leads participants through an exploration of the many aspects and attributes of that mysterious quantity, pi. Activities range from using statistical experimentation to...
Illustrative Mathematics
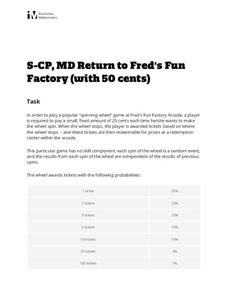
Return to Fred's Fun Factory (with 50 Cents)
The penny arcade gets the statistics treatment in this fun probability investigation. A non-standard game of chance is described and then the class is set loose to find missing probabilities, determine common outcomes, and evaluate...
EngageNY
Describing Distributions Using the Mean and MAD
What city has the most consistent temperatures? Pupils use the mean and mean absolute deviation to describe various data sets including the average temperature in several cities. The 10th lesson in the 22-part series asks learners to...
Howard Hughes Medical Institute
Evolution in Action: Data Analysis
An environmental factor, such as a drought, sometimes speeds up the rate of natural selection. Scholars analyze data on the beaks of birds around the time of the drought. They compare those that survived to those that perished and find...
Howard Hughes Medical Institute
Using Genetic Crosses to Analyze a Stickleback Trait
Two fish appear different, but how do scientists determine their genotypes? Scholars practice performing test crosses to determine the genotypes of fish given their phenotypes. They answer in-depth comprehension questions and complete...
American Statistical Association
Who Has the Longest First Name?
Name that statistic! Classmates each write their name and the number of letters in it on a sticky note to place on the board. As a class, they determine the median, mode, and range of the name lengths, and create a dot plot of the data....
Education Development Center
Creating Data Sets from Statistical Measures
Explore the measures of central tendency through a challenging task. Given values for the mean, median, mode, and range, collaborative groups create a set of data that would produce those values. They then critique other answers and...
Education Development Center
Interpreting Statistical Measures—Class Scores
Explore the effect of outliers through an analysis of mean, median, and standard deviation. Your classes examine and compare these measures for two groups. They must make sense of a group that has a higher mean but lower median compared...
Alabama Department of Archives and History
A Worse Death: War or Flu?
In a instructional activity that integrates history and mathematics, class members create graphs that compare military death statistics from World War I with those that resulted from the influenza pandemic of 1918.
Smarter Balanced
Food Waste and Food Access
Forty percent of food in the US goes uneaten while 14.5 percent of US households lack a secure supply of food. As part of the preparation for a performance task assessment, groups consider statistics such as these about food waste and...
Illustrative Mathematics
Accuracy of Carbon 14 Dating II
The scientific issue of carbon-14 dating and exponential decay gets a statistics-based treatment in this problem. The class starts with a basic investigation of carbon content, but then branches out to questions of accuracy and ranges of...
EngageNY
Sampling Variability
Work it out — find the average time clients spend at a gym. Pupils use a table of random digits to collect a sample of times fitness buffs are working out. The scholars use their random sample to calculate an estimate of the mean of the...
Curated OER
Re-Presenting Race in the Digital Age
Teen-aged scientists analyze a graphic organizer of how trash is removed from New York City and then answer standard questions about a graph and a diagram. Resources are mentioned, but there are no links to these resources, so you will...
Curated OER
Using Random Sampling to Draw Inferences
Emerging statisticians develop the ability to make inferences from sample data while also working on proportional relationships in general. Here, young learners examine samples for bias, and then use random samples to make inferences...
Social Media Toolbox
Social Media Survey
Survey says ... social media is here to stay! How do the pupils in your school use social media? Using lesson four from a 16-part series, The Social Media Toolbox, learners study surveys and create their own. The resource includes...
Pace University
Grade 7 Earth Day Statistics with Circle and Bar Graphs
Take a tiered approach to studying waste. The lesson plan uses Earth Day to present differentiated instruction around using circle and bar graphs. Each group gets a cube based on their tiers and works collaboratively as well as...
Curated OER
Problem Solving and the Sports Page
The use of box scores from baseball games is the foundation of this math lesson. Organize your class into groups of four, and give identical box scores from a baseball game that was just played. Have them create word problems from the...
Alabama Department of Archives and History
Strange Fruit: Lynching in America
To continue their study of the Civil War, Reconstruction, and the beginning of the civil rights movement, class members watch the YouTube video of Billie Holiday singing "Strange Fruit" as an introduction to an examination of lynching in...
Mathalicious
Three Shots
To foul or not to foul, that is the basketball question. High schoolers look at the probability that fouling out a player and allowing free throws yields a better outcome than allowing the original shot. The resource provides a teacher's...
US Department of Commerce
Featured Activity: Exploring Questions for the 2020 Census
Just what is the census for? Using data and census questions, class members explore how officials gather information. Then, they consider how the government uses the answers to determine how it spends its money with a collaborative...
Constitutional Rights Foundation
Issues of Asylum in the U.S.
Who gets to come to the United States? Examine cases of individuals seeking asylum with an informative reading passage that includes examples, statistics, and representations of public opinion regarding asylum. Groups then go on to...
National Wildlife Federation
Stifling, Oppressive, Sweltering, Oh My!
Looking for a hot date? Pick any day in August, statistically the hottest month in the United States. The 15th lesson in the series of 21 instructs pupils to investigate the August 2007 heat wave through NASA data, daily temperature...
Deliberating in a Democracy
Cyberbullying—Alternate Lesson Plan
Should schools be permitted to punish young scholars for off-campus cyberbullying? After reading a passage that details statistics about cyberbullying and Supreme Court rulings about schools' ability to limit student speech, class...
Smithsonian Institution
The Price of Freedom: Americans at War
An interactive resource covers all of the United States' most prominent and influential historic wars including the Vietnam War, the Cold War, the War of 1812, and the Korean War. Learners observe cause and effect as well as how violence...
Other popular searches
- Data, Census, & Statistics
- Probability and Statistics
- Educational Statistics
- Baseball Statistics
- Math Statistics
- Climate Statistics
- Math Lessons Statistics
- Median and Mean Statistics
- Statistics Lesson Plans
- Sports and Statistics
- Probability Statistics
- Black Plague Statistics


