Curated OER
In the Billions and Linear Modeling
Your learners analyze population data to discern if it best fits a linear scenario. The idea of change by equal differences over equal intervals is enforced in this real-life task.
EngageNY
Modeling Relationships with a Line
What linear equation will fit this data, and how close is it? Through discussion and partner work, young mathematicians learn the procedure to determine a regression line in order to make predictions from the data.
EngageNY
Relationships Between Two Numerical Variables
Working in small groups and in pairs, classmates build an understanding of what types of relationships can be used to model individual scatter plots. The nonlinear scatter plots in this lesson on relationships between two numerical...
American Statistical Association
What Fits?
The bounce of a golf ball changes the result in golf, mini golf—and a great math activity. Scholars graph the height of golf ball bounces before finding a line of best fit. They analyze their own data and the results of others to better...
EngageNY
Relationships Between Two Numerical Variables
Is there another way to view whether the data is linear or not? Class members work alone and in pairs to create scatter plots in order to determine whether there is a linear pattern or not. The exit ticket provides a quick way to...
Mathalicious
The Fall of Javert
Falling off a bridge might not sound like your idea of a good math problem, but incorporating the final scene of Les Misérables is sure to spark interest. The goal is to use the time Javert fell off the bridge to determine how high he...
Georgetown University
Cup-Activity: Writing Equations From Data
Determine how cup stacking relates to linear equations. Pupils stack cups and record the heights. Using the data collected, learners develop a linear equation that models the height. The scholars then interpret the slope and the...
Curated OER
Basketball Bounces, Assessment Variation 1
This highly scaffolded, summative assessment tasks learners to choose the model that represents the height of a bouncing basketball given the data in graph and table form. Learners then use the model to answer questions about the...
Virginia Department of Education
Linear Curve of Best Fit
Is foot length to forearm length a linear association? The class collects data of fellow scholars' foot length and the length of their forearms. They plot the data and find a line of best fit. Using that line, they make predictions of...
Curated OER
Basketball Bounces, Assessment Variation 2
This un-scaffold summative assessment tasks learners to use the height of a bouncing basketball, given the data in graph and table form, to choose the model that is represented. Learners then use the model to answer questions about the...
Mascil Project
Closed Greenhouses
Controlling the efficiency of a greenhouse is a mathematical task. A collaborative project challenges learners to create an efficiency plan for a closed greenhouse. Using algebraic equations, they consider a set of constraints, design...
Curated OER
Stochastic and Deterministic Modeling
Explore the difference between stochastic and deterministic modeling through programming. First have the class write algorithms for relatively simple tasks using pseudocode. Use the Python 2.7 program app to simulate Mendel's Pea Pod...
Curated OER
Rumors
Your young gossipers write an exponential function for the number of people who have heard a rumor after a number of days have passed. Learners then answer a series of questions, including whether or not the solutions are realistic by...
EngageNY
Analyzing a Graph
Collaborative groups utilize their knowledge of parent functions and transformations to determine the equations associated with graphs. The graph is then related to the scenario it represents.
Curated OER
Logarithmic Functions
Learners explore the characteristics of logarithmic functions and their relationship to exponential functions. Using the subscriber website Explorelearning.com, pupils observe changes in the input variable and its effect on the graph of...
NASA
Lights on the International Space Station
Groups explore illumination with NASA's Lighting Environment Test Facility (LETF) as a context. Using the TI-Nspire app, groups determine the lux equation that models their simulation. They then use the lux equation to solve problems...
Mathalicious
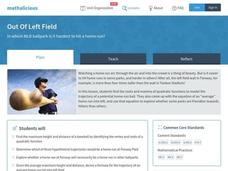
Out of Left Field
A baseball trajectory and a parabola seem to make the best pair in real-world quadratic applications. Here is a current baseball resource with questions, discussions, and explorations regarding a quadratic function and home run...
EngageNY
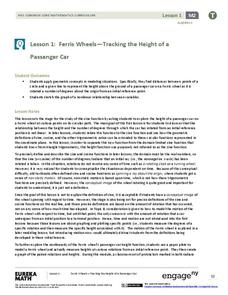
Ferris Wheels—Tracking the Height of a Passenger Car
Watch your pupils go round and round as they explore periodic behavior. Learners graph the height of a Ferris wheel over time. They repeat the process with Ferris wheels of different diameters.
Virginia Department of Education
Quadratic Curve of Best Fit
Class members create a table of the number of chords that can be drawn given the number of points on a circle. Pupils analyze the data created, find a function to fit to it, and use the function to make further predictions.
Curated OER
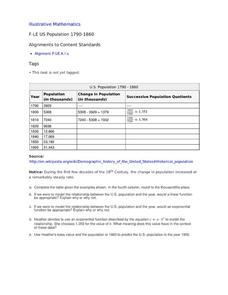
US Population 1790-1860
Your young population scientists analyze a table of values, write a model to represent the real life data, finish the table of data and predict future populations in a collaborative, real-life activity.
Annenberg Foundation
Skeeters Are Overrunning the World
Skeeters are used to model linear and exponential population growth in a wonderfully organized lesson plan including teachers' and students' notes, an assignment, graphs, tables, and equations. Filled with constant deep-reaching...
Natinal Math + Science Initative
Slope Investigation
Context is the key to understanding slope. A real-world application of slope uses a weight loss scenario with a constant rate of change to introduce the concept of slope of a line, before it makes a connection to the ordered pairs and...
National Research Center for Career and Technical Education
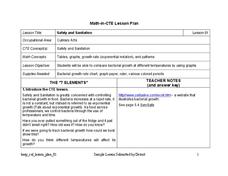
Safety and Sanitation
Your microbiologists explore the graphing of exponential growth functions using bacteria, like e. coli and salmonella, in a well-written, career and technology lesson plan.
Mathalicious
Pic Me!
Finally! Math and Instagram have come together to discuss the correlation between likes and followers. High schoolers can't help but want to discover what makes one account more popular than another by developing a line of best fit and...


