Mathed Up!
Pie Charts
Representing data is as easy as pie. Class members construct pie charts given a frequency table. Individuals then determine the size of the angles needed for each sector and interpret the size of sectors within the context of frequency....
EngageNY
Grade 5 Math Module 1, Topic A, Lesson 1
Extend the place value system. The first lesson plan in a series of 18 extends the place value system to millions through thousandths. Using place value charts, pupils see how the value of a digit changes as it moves places. Teachers use...
University of Missouri
Money Math
Young mathematicians put their skills to the test in the real world during this four-lesson consumer math unit. Whether they are learning how compound interest can make them millionaires, calculating the cost of remodeling their bedroom,...
Curriculum Corner
Back to School Math and Literacy Centers
From filling in the missing number to filling in the missing letter; to writing fluency sentences to skip counting and matching, a complete set of back to school math a literacy centers will not disappoint. Use these activities during...
State of Michigan
Pre-K Mathematics
Kick-start children's education with this pre-school math unit. Offering 31 different hands-on learning activities that develop young mathematicians' pattern and shape recognition, basic number sense, and much more, this is a must-have...
Beyond Benign
Municipal Waste Generation
Statistically, waste may become a problem in the future if people do not take action. Using their knowledge of statistics and data representation, pupils take a look at the idea of waste generation. The four-part unit has class members...
Curated OER
Games on Echolocation
Get a little batty with life science! This fun simulation game replicates how bats use echolocation to hunt moths in their native Hawaiian habitat. After creating blind folds and discussing some basic principles of echolocation, students...
Curated OER
Twenty Questions: The Hundred Chart
Use the 20 Questions game to practice math vocabulary and number properties! Project a hundreds chart and hand one out to learners. Ideally, give them counters (beans would work well) to mark off the chart so you can play multiple times....
Scholastic
Adding and Subtracting Ten
Developing fluency with basic addition and subtraction is fundamental to the success of all young mathematicians. This four-day lesson series begins with learners using ten-frames and hundreds charts to recognize patterns when adding and...
PBS
The Lowdown — U.S. Gun Homicides: Visualizing the Numbers
Is gun violence a big issue in America? Pupils explore gun deaths by type, race, and age group in a Math at the Core: Ratios interactive. The class tries to determine whether America is a safe place to live and use bar graphs and pie...
Curated OER
All About Money
Few topics engage young mathematicians as much as learning about money. Through a series of shared readings and hands-on activities, children explore the US currency system, learning how to count money and calculate change as they create...
Curated OER
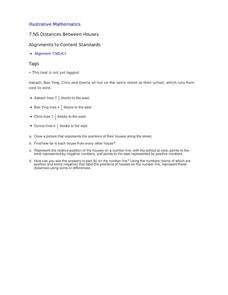
Distances Between Houses
This resource sneaks in the math so your learners will be adding and subtracting positive and negatives on a number line while thinking they are mapping out houses. The activity starts by putting houses the appropriate distance away from...
Curated OER
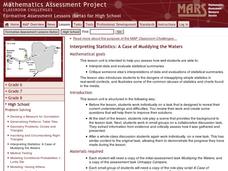
Interpreting Statistics: A Case of Muddying the Waters
Is river pollution affecting the number of visitors to Riverside Center, and is the factory built upstream the cause of the pollution? Let your class be the judge, literally, as they weigh the statistical evidence offered by the factory...
Curated OER
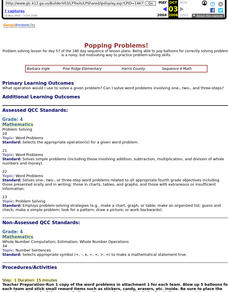
Popping Problems!
Turn your math instructional activity into a carnival game with this fun, outdoor activity. After reviewing the concept your class will be practicing briefly, split your class up into teams and head outdoors. These teams work to solve...
Curated OER
Where We Live
Who has the most? Young learners practice charting data using familiar information. They help fill out a classroom chart by recording the number of people, pets, televisions, etc. in their home. Guiding questions help them investigate...
Mascil Project
Drug Concentration
Different medications leave the body at different rates, and how people take them determines their effectiveness. Learners investigate this effectiveness by charting the concentration of a given medication in the body. Using exponential...
Curated OER
Can You Count on Cans?
How can a canned food drive be connected to math? It's as simple as counting and organizing the cans! Children demonstrate their ability to sort non-perishable foods into categories that include soup cans, vegetable cans, boxed items,...
Project Maths
Introduction to Trigonometry
The topic of trigonometric ratios is often covered with loads of rote memorization baked into the activity. This activity set, however, leans more on using similar triangles and discovery learning to help young geometers develop a deeper...
Pace University
Grade 7 Earth Day Statistics with Circle and Bar Graphs
Take a tiered approach to studying waste. The lesson uses Earth Day to present differentiated instruction around using circle and bar graphs. Each group gets a cube based on their tiers and works collaboratively as well as individually...
US Department of Commerce
Featured Activity: Population Change Over Time
Keep track of a state's population. After a brief discussion on how population data is used for funding, individuals look at population changes over time. Pupils find the population of two states using three different censuses. They then...
EngageNY
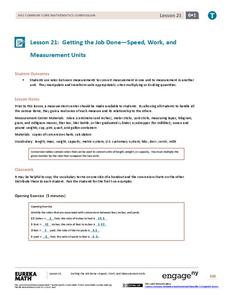
Getting the Job Done—Speed, Work, and Measurement Units
How do you convert from one measurement to another? Pupils use unit rates to convert measurements from one unit to another in the 21st segment in a 29-part series. They convert within the same system to solve length, capacity, weight,...
EngageNY
Mixture Problems
What percent of the mixture is juice? Pairs use their knowledge of proportions to determine what percent a mixture is juice given the percent of juice in the components. Pupils use the procedure learned with the juice mixture problem to...
EngageNY
Solving Area Problems Using Scale Drawings
Calculate the areas of scale drawings until a more efficient method emerges. Pupils find the relationship between the scale factor of a scale drawing and the scale of the areas. They determine the scale of the areas is the square of the...
Curated OER
Ornithology and Real World Science
Double click that mouse because you just found an amazing lesson! This cross-curricular Ornithology lesson incorporates literature, writing, reading informational text, data collection, scientific inquiry, Internet research, art, and...
Other popular searches
- Charts and Graphs Math
- Kwl Charts Math
- Input Output Math Charts
- Kl Charts Math
- T Charts in Math
- Kl Charts Math 6th
- Kwl Charts Math 6th
- Free Math Charts
- Input/output Math Charts
- Kwl Charts Math Lesson
- Math Charts Graphs
- Reading Math Charts


