Illustrative Mathematics
How Much is a Penny Worth?
Are pennies really worth one cent? Here, learners use rates to calculate the price per pound of copper that would result in pennies that are exactly one cent's worth of copper. Might work best as a group or whole-class activity since the...
EngageNY
Interpreting the Standard Deviation
Does standard deviation work for non-symmetrical distributions, and what does it mean? Through the use of examples, high schoolers determine the standard deviation of a variety of distributions and interpret its meaning. Problems require...
EngageNY
Analyzing Graphs—Water Usage During a Typical Day at School
Connect your pupils to the problem by presenting a situation with which they can identify. Individuals analyze a graph of water use at a school by reasoning and making conclusions about the day. The lesson emphasizes units and labels of...
West Contra Costa Unified School District
The Power of Ten: Building a Magnitude Model
Add visual representation to teaching place value with a magnitude model. Using adding machine tape, pupils build a linear place value strip from 1 to 100.
American Statistical Association
What is the Probability of “Pigging Out”
Learners apply their understanding of luck to a probability experiment. They play a game of Pass the Pigs to determine the probability of a specific outcome. Using analysis for their data, pupils declare the measures of center, dot...
Mathematics Vision Project
Module 7: Connecting Algebra and Geometry
The coordinate plane links key geometry and algebra concepts in this approachable but rigorous unit. The class starts by developing the distance formula from the Pythagorean Theorem, then moves to applications of slope. Activities...
EngageNY
From Ratio Tables to Double Number Line Diagrams
How much sugar is in one bottle? Pupils use double number line diagrams to determine the amount of sugar in a 1L bottle of cola. The teacher leads a discussion on ways that double number lines can be of assistance in solving a problem...
Curated OER
Get a Leg Up
Traveling through space is an amazing experience, but it definitely takes a toll on the body. After reading an article and watching a brief video, learners perform an experiment that simulates the effects of zero gravity on the human body.
Mary Pope Osborne, Classroom Adventures Program
Mummies in the Morning Egyptian pyramids, hieroglyphics
Visit the Magic Treehouse and take your class on a trip through time with a reading of the children's book Mummies in the Morning. Using the story to spark an investigation into Egyptian culture, this literature unit engages...
BW Walch
Creating and Graphing Exponential Equations
Frequently found in biology and economic application problems, exponential equations show up as stars in this introductory presentation. Taking no background or knowledge of exponentials for granted, the slides walk learners through the...
EngageNY
Solving Percent Problems
Don't discount how much your pupils understand percents! The 27th lesson in a series of 29 presents a problem to find the cost of a discounted outfit. Small groups determine either the original price or the discount received given the...
Virginia Department of Education
Similar Triangles
Pupils work in pairs to investigate what it takes to prove that two triangles are similar. They work through various shortcuts to find which are enough to show a similarity relationship between the triangles. Small groups work with the...
Virginia Department of Education
Constructions
Pupils learn the steps for basic constructions using a straightedge, a compass, and a pencil. Pairs develop the skills to copy a segment and an angle, bisect a segment and an angle, and construct parallel and perpendicular lines.
Curated OER
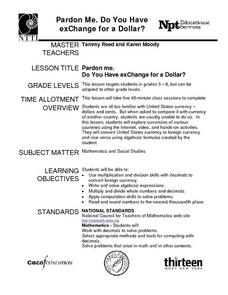
Pardon Me. Do You Have Change For a Dollar?
Upper elementary and middle school learners explore currencies from a variety of countries. They use the Internet, video, and engage in hands-on activities. They practice converting U.S. currency to foreign currency and vice versa. This...
Curated OER
Modeling Conditional Probabilities 1: Lucky Dip
Check out this detailed lesson plan on conditional probability! Learners work individually and also collaboratively to analyze the fairness of a game and justify their reasoning. it includes detailed notes and many helpful suggestions...
Mathematics Assessment Project
Representing 3-D Objects in 2-D
How does the shape of the surface of water in a container change as water leaks out? After tackling this question, learners take part in a similar activity with more complex figures.
Illustrative Mathematics
Counting Overview
Develop automatic, meaningful counting skills with your class by using everyday classroom/school items, objects, and opportunities. Counting skills should be practiced during the year using objects and items they are familiar with and...
Mathematics Vision Project
Modeling Data
Is there a better way to display data to analyze it? Pupils represent data in a variety of ways using number lines, coordinate graphs, and tables. They determine that certain displays work with different types of data and use two-way...
Alabama Learning Exchange
Human Slope
Middle and high schoolers explore the concept of slope. In this slope lesson, learners graph lines using a life-size graph. They use chalk on a blacktop to create a coordinate plane and use each other as the tick marks on the grid....
Mathematics Vision Project
Module 8: Modeling Data
Statistics come front and center in this unit all about analyzing discrete data. Real-world situations yield data sets that the class then uses to tease out connections and conclusions. Beginning with the basic histogram and...
EngageNY
Graphing the Logarithmic Function
Teach collaboration and communication skills in addition to graphing logarithmic functions. Scholars in different groups graph different logarithmic functions by hand using provided coordinate points. These graphs provide the basis for...
EngageNY
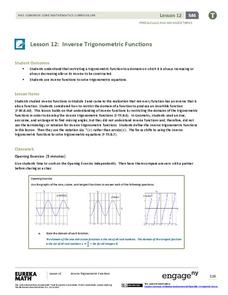
Inverse Trigonometric Functions
Build on the understanding of finding angles using trigonometric ratios. Pupils develop the definitions of inverse trigonometric functions by restricting their domains in the 13th lesson of a 16-part series. They use inverse functional...
Curated OER
Finding Common Denominators to Subtract
Subtracting fractions with unlike denominators can be overwhelming, but in this task, 5th graders work systematically to break down the procedure through three questions. The first two questions ask for pictures to be drawn along with...
Illustrative Mathematics
Puzzle Times
Give your mathematicians this set of data and have them create a dot plot, then find mean and median. They are asked to question the values of the mean and median and decide why they are not equal. Have learners write their answers or...


