EngageNY
Interpreting, Integrating, and Sharing Information: Using Charts and Graphs about DDT
Is American growing fatter? Scholars begin with a mini lesson on reading charts and graphs using information about Human Body Fat in United States. They then transfer what they learned to charts and graphs using harmful and...
Florida Center for Reading Research
Fluency: Words, Speedy Rime Words
Learners time each other as they read as many rime words as possible.
Mathed Up!
Pie Charts
Representing data is as easy as pie. Class members construct pie charts given a frequency table. Individuals then determine the size of the angles needed for each sector and interpret the size of sectors within the context of frequency....
The New York Times
The Careful Reader: Teaching Critical Reading Skills with the New York Times
The 11 lessons in this educators' guide focus on using newspapers to develop critical reading skills in the content areas.
ReadWriteThink
"Three Stones Back": Using Informational Text to Enhance Understanding of Ball Don't Lie
"Three Stones Back," a passage from Matt de la Pena's best-seller, Ball Don't Lie, allows readers to practice their close reading skills as they compare the passage to an information text about wealth inequality.
Deliberating in a Democracy
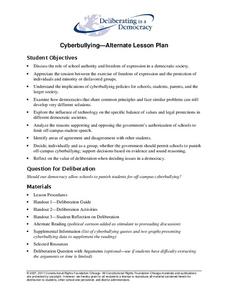
Cyberbullying—Alternate Lesson Plan
Should schools be permitted to punish young scholars for off-campus cyberbullying? After reading a passage that details statistics about cyberbullying and Supreme Court rulings about schools' ability to limit student speech,...
Beyond Benign
Municipal Waste Generation
Statistically, waste may become a problem in the future if people do not take action. Using their knowledge of statistics and data representation, pupils take a look at the idea of waste generation. The four-part unit has class members...
Shmoop
ELA.CCSS.ELA-Literacy.RI.11-12.7
Comparing information found in images, charts, and graphs with that found in written text can be a challenge for even senior high scholars. Provide learners with an opportunity to practice this skill with an exercise that asks them to...
Anti-Defamation League
Sixty Years Later
Has any progress been made in desegregating schools since 1954's Supreme Court case Brown v. Board of Education? To find out, class members examine charts and graphs representing U.S. schools' racial, ethnic, and socioeconomic...
Anti-Defamation League
Women’s Inequity in Pay: Could It Be Sexism, Implicit Bias or Both?
Equal pay for equal work? High schoolers research the reasons for the inequity in women's pay. They read articles, examine graphs, engage in discussion, and then craft an essay in which they suggest a way to address the gender wage gap.
Prestwick House
New (March 2016) SAT Reading Test Practice
The SAT. The ACT. AP exams. The very mention of these exams can cause the college bound to feel anxious. One way to combat Test Anxiety is to provide high schoolers with models of these tests and give them opportunities to analyze...
Federal Reserve Bank
The Story of the Federal Reserve: High School Lesson Plan
Is there a bank for the banks? Pupils analyze the complexities of the Federal Reserve system by breaking it down into easy-to-understand sections. Step-by-step investigation using flow charts and graphs of how the monetary system works...
EngageNY
Interpreting, Integrating, and Sharing Information about DDT: Using Cascading Consequences and Fishbowl Protocol
What is your interpretation? Scholars look at their Cascading Consequences Charts and interpret the information they have gathered. Learners match claims with evidence and then watch a video. At the end, they carry out a fishbowl...
EngageNY
Building Background Knowledge: Colonial Craftspeople
In the first lesson plan of this unit on colonial trade, fourth graders gain background knowledge of different jobs performed by early colonists. The class begins with a slide show presentation that includes a variety of great...
EngageNY
Discovering the Topic: Inferring and Confirming Using Evidence
Allow your class to figure out what they will be studying through an inquiry-based anticipatory set that involves analysis of mystery documents and practice with making inferences. The lesson plan document includes a detailed description...
Virginia Department of Education
Solar System Model
How many planets can you name? Did you get all 13 in our solar system, including the dwarf planets, or were you surprised when you read there are 13 planets? The lesson helps scholars understand the scale of the universe including the...
Curated OER
Ornithology and Real World Science
Double click that mouse because you just found an amazing lesson! This cross-curricular Ornithology lesson incorporates literature, writing, reading informational text, data collection, scientific inquiry, Internet research, art, and...
Curated OER
Dragonwings: Explore Chapters 1-5
If you are beginning Laurence Yep's Dragonwings, this will provide activities for the first five chapters. The objectives include making connections to oneself and the world, organizing information and events, vocabulary acquisition,...
Serendip
Changing Biological Communities – Disturbance and Succession
After cutting down a forest to make a farm, how long would it take the environment to turn an abandoned farm back into a forest? Scholars study this exact scenario while they interpret many charts and graphs of the changing ecosystems as...
EngageNY
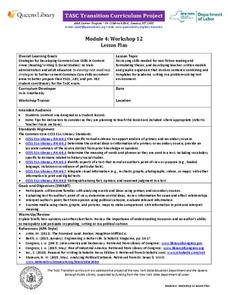
TASC Transition Curriculum: Workshop 12
How can opinions slant facts? Workshop participants learn how to examine primary and secondary sources and identify the author's point of view. They also examine how visual art impacts the meaning and rhetoric of sources. Full of...
Missouri Department of Elementary
Respect for Self and Others—Giving and Getting the Big R
Tween find out what it means to give and get respect. After reviewing the Recipe for Relationships studied in a previous lesson, groups create a dramatization of two-minute scenario in which an individual behaves inappropriately in a...
Code.org
Good and Bad Data Visualizations
Good versus bad data. Pairs rate online collections of data representations from good to bad and then suggest ways to improve the visualizations. The class then creates a list of best practices and common errors in data representations...
Prestwick House
Catcher in the Rye Activity Pack
The Catcher in the Rye is the focus of a sampler that models some of activities included in a for-purchase packet based on J. D. Salinger's novel.
Delegation of the European Union to the United States
The Geography of Europe
What is the European Union? Where is it? Why is it? To begin a study of the EU, class members examine the physical geography of Europe and the size and population density of 28-member countries in comparison to non-member countries...


