Kenan Fellows
Saving Those Who Save Us: Exploring the Use of Sensors with Data Visualization
Sensor technology is amazingly accurate and useful. Combining the sensor technology and mathematical knowledge, scholars design experiments to answer a question they have developed. Questions may focus on light sensing, temperature...
PBL Pathways
College Costs 2
What is the financial benefit for attending a community college for the first two years before transferring to a four-year college? The second part of the educational lesson asks young scholars to explore this question through data...
PBL Pathways
Doctors and Nurses
How many nurses does it take to support one doctor? A project-based activity asks learners to analyze state data to answer this question. Classes create polynomial functions from the data of doctors and nurses over a seven-year period....
Curated OER
Scatter Plots
Seventh graders investigate how to make and set up a scatter plot. In this statistics lesson, 7th graders collect data and plot it. They analyze their data and discuss their results.
Curated OER
Environmental Agents of Mathematics: Mathematics for Change
High schoolers analyze environmental science data using Math. They do research about renewable energy, gather data, create graphs and interpret their findings. Then the group presents their arguments persuasively using their findings to...
Curated OER
Ornithology and Real World Science
Double click that mouse because you just found an amazing lesson! This cross-curricular Ornithology lesson incorporates literature, writing, reading informational text, data collection, scientific inquiry, Internet research, art, and...
PBL Pathways
Students and Teachers
Predict the future of education through a mathematical analysis. Using a project-based learning strategy, classes examine the pattern of student-to-teacher ratios over a period of years. Provided with the relevant data, learners create a...
PBL Pathways
Do Homework?
To complete homework or not to complete homework ... that is the question. Decide whether it makes a difference on finals by doing homework. Individuals create a scatter plot and find a line of best fit for data on the percent of...
PBL Pathways
College Costs
Predict the year that college costs will double in your state using linear modeling. The first part of this two-part project based learning activity asks young mathematicians to use data from the College Board. They graph the data, write...
Curated OER
Is there Treasure in Trash?
More people, more garbage! Young environmentalists graph population growth against the amount of garbage generated per year and find a linear model that best fits the data. This is an older resource that could benefit from more recent...
PBL Pathways
Students and Teachers 2
Examine trends in student-to-teacher ratios over time. Building from the first task in the two-part series, classes now explore the pattern of student-to-teacher ratios using a non-linear function. After trying to connect the pattern to...
Curated OER
Remembering Our Veterans Data Management Project
Seventh graders utilize data collected from various sources based on Canadian military statistics to consolidate their understanding of data management. Students plan and create a PowerPoint presentation using this data including in...
Radford University
Government Spending
Spend some time with lines of best fit. An informative unit has learners investigate government spending. They research data on poverty, educational spending, social security, and defense spending, and then analyze lines of best fit for...
Beyond Benign
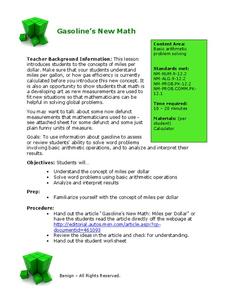
Got Gas
How much gas does it take to drive around town? The class uses a variety of mathematical procedures to take a look at the use of gas for transportation. Class members use a different unit to determine the cost of driving a car as opposed...
Curated OER
Cruising the Internet
Students identify the parts of an engine using a graph. For this statistics lesson, students make a graph from their collected data. They calculate the volume of a cylinder using a line of regression and a scatter plot.
Curated OER
How Much Is Too Much?
Students examine population growth and collect data. In this statistics lesson, students create a scatter plot to represent the different species found in the water and are being harvested. They graph their data and draw conclusion from it.
Curated OER
Bias in Statistics
Students work to develop surveys and collect data. They display the data using circle graphs, histograms, box and whisker plots, and scatter plots. Students use multimedia tools to develop a visual presentation to display their data.
Alabama Learning Exchange
The State Capital of Stem and Leaf
Students explore the concept of stem and leaf plots. For this stem and leaf plots lesson, students plot the 50 US states' capitals on a stem and leaf plot according to the first letter of each state. Students compare their stem and...
Curated OER
Reaching New Heights
Pupils explore the relationship between two variables. Students measure their arm span and height. They gather this class data to design a scatter plot. Pupils interpret the meaning of individual coordinates and the overall graph. ...
Beyond Benign
Water Bottle Unit
How much plastic do manufacturers use to create water bottles each year? The class explores the number of water bottles used throughout the years to determine how many consumers will use in the future. Class members compare different...
Curated OER
A Closer Look: Unemployment
Students view a video clip about unemployment. They research data and create a scatter plot graph. They discover the importance of graphs and what they can tell us. They create their own publication on unemployment.
Radford University
Marketing Mayhem: Advertising for Adolescents
You'll be sold on using the resource. Future consumers first conduct a sample survey on marketing strategies. They then consider how mass media influences their age groups and create presentations to display their findings.
Curated OER
A Fishy Tale
Eighth graders do a research project on a particular species of Atlantic seafood and record and graph information pertaining to commercial landings of that species of seafood. They use a website and an Appleworks spreadsheet.
Curated OER
How can my breakfast help the birds?
Sixth graders design farms with a bird's habitat in mind. For this farm lesson plan, 6th graders research how sun grown coffee destroys a bird habitat, and then they make their own farm with a bird's habitat being preserved. They then...


