101 Questions
Deodorant
Smells like learning! Young scholars collect data on the length of time a stick of deodorant lasts. After modeling the data with a graph and function, they make predictions about deodorant use over time.
101 Questions
Toothpicks
Analyze patterns and build functions. Young scholars work on their modeling skills with an inquiry-based lesson. After watching a video presentation of the problem, they write functions and make predictions.
101 Questions
Jam Session
Don't let the learning in your classroom get jammed up! Intrigue your scholars with an open-ended scenario to explore. A video presentation shows a challenging stretch of road that is susceptible to traffic jams. The task is to determine...
101 Questions
Snow Day
Who doesn't like a snow day? Learners watch a snow accumulation over a span of 10 hours. They use that information to make a prediction of the total snow that fell during the 23-hour snowfall. Will it be enough to cancel school?
Curated OER
Making Money and Spreading the Flu!
Paper folding, flu spreading in a school, bacteria growth, and continuously compounded interest all provide excellent models to study exponential functions. This is a comprehensive resource that looks at many different aspects of these...
Curated OER
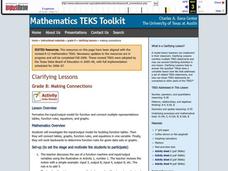
Making Connections
Eighth graders investigate the input/output model for building function tables. From the data, 8th graders connect tables, graphs, function rules, and equations in one variable. They work backwards to determine function rules for given...
EngageNY
Trigonometric Identity Proofs
Proving a trig identity might just be easier than proving your own identity at the airport. Learners first investigate a table of values to determine and prove the addition formulas for sine and cosine. They then use this result to...
Curated OER
The Barbie Bungee Drop
What do math, bungee jumping, and Barbie® have in common? Young adventure seekers use rubber bands as bungee cords to predict a thrilling, but safe, jump for their doll. First, test jumps are conducted with a few rubber bands. Then more...
Curated OER
Equal Differences Over Equal Intervals 2
Your algebra learners explore linear functions concretely using tables of values in a collaborative task. The idea that linear function values change by equal differences over equal intervals, is emphasized. The slope and y-intercept...
Curated OER
Equal Differences Over Equal Intervals 1
Learners explore linear functions concretely using tables of values in a cooperative task. The concept of the values of linear functions changing by equal differences over equal intervals of one is emphasized. Learners will discover the...
Curated OER
Extending the Definitions of Exponents, Variation 2
Introduce the concept of exponential functions with an activity that extends the definition of exponents to include rational values. Start with a doubling function at integer values of time, then expand table to include frational time...
Illustrative Mathematics
Chocolate Bar Sales
In this real-world example, algebra learners start to get a sense of how to represent the relationship between two variables in different ways. They start by looking at a partial table of values that define a linear relationship. They...
Curated OER
Equal Factors Over Equal Intervals
Exponential functions and their growth rates are explored concretely using tables in a collaborative task. Then the successive quotient is explored algebraically.
Curated OER
Exponential Growth versus Linear Growth II
Your algebra learners discover that exponential functions, with a base larger than one, outgrow linear functions when the inputs increase sufficiently. Their analysis includes using a graphing calculator to produce tables.
EngageNY
The Most Important Property of Logarithms
Won't the other properties be sad to learn that they're not the most important? The 11th installment of a 35-part module is essentially a continuation of the previous instructional activity, using logarithm tables to develop properties....
Curated OER
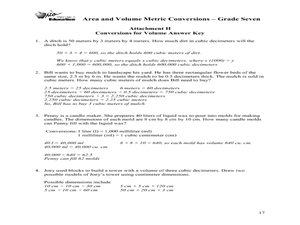
Area and Volume Metric Conversions - Grade Seven
Students investigate unit conversion. In this unit conversion lesson plan, students will build models of square and cubic centimeters using grid paper and generate formula tables for converting units of area and volume. The tables will...
Curated OER
Exponential Growth versus Polynomial Growth
Your algebra learners explore the values of two types of functions in order to compare growth rates in this short cooperative task. Two types of solutions are given, using a table of values and an abstract argument.
Curated OER
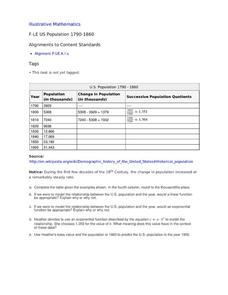
US Population 1790-1860
Your young population scientists analyze a table of values, write a model to represent the real life data, finish the table of data and predict future populations in a collaborative, real-life activity.
Balanced Assessment
Books from Andonov
To examine mathematical functions in a modeling situation pupils combine quadratic and step functions to represent a presented scenario. They both graph and write a function to represent data shown in a table.
Curated OER
Does Your Field Measure Up
Students measure angles using a plane table kit. In this geometry lesson, students use trigonometric identities to find the values of the length of a football field.
Curated OER
Exploring Renewable Energy Through Graphs and Statistics
Ninth graders identify different sources of renewable and nonrenewable energy. In this math lesson, learners calculate their own carbon footprint based on the carbon dioxide they create daily. They use statistics to analyze data on power...
Curated OER
Lesson Plan 2: Hot Dog Sales - Solving Linear Equations and Inequalities
This lesson will provide students with an introduction to solving equations and inequalities numerically (using a table), graphically, and algebraically. they devise a table that would produce information about the number of hot dogs...
Curated OER
Do These Systems Meet Your Expectations
This lesson is all about systems of equations and their graphs. Algebra learners create and solve systems of equation using tables and graphing. They identify the point of intersection of a system of equation, and discover what the...
Agile Mind
Rabbit populations
In this real-world problem about the rapid growth of rabbit populations, students must analyze two different scenarios and create mathematical models to represent them. They use their exponential models to answer questions about the...
Other popular searches
- Math Tables and Tools
- +Math Tables Tips Tools
- Input Output Table Math
- Math Table. Elementary Math
- Math Tables Tips Tools
- Math Tables and Graphs
- Making Math Tables
- Input/output Tables Math
- Math Table Elementary Math
- Learning Math Tables
- Math Tables Multiplacation
- Making a Math Table


