Curated OER
Bagel Algebra
Ninth graders apply proportional reasoning to a real-life situation. In this Algebra I lesson, 9th graders explore a series of equations that relate to a display sign that compares the owner’s bagels to competitors bagels. Students...
Education Development Center
Area and Multiplication
Take some intellectual fun and apply it to the concept of multiplying expressions together. A guide models how to break two numbers into an area model to multiply together in pieces similar to FOILing. The rest of the puzzles consist of...
EngageNY
Using Sample Data to Estimate a Population Characteristic
How many of the pupils at your school think selling soda would be a good idea? Show learners how to develop a study to answer questions like these! The lesson explores the meaning of a population versus a sample and how to interpret the...
Sri Atmananda Memorial School
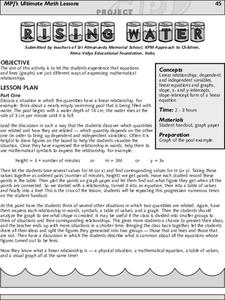
Rising Water
An engaging, and not to mention attractive, lesson plan has prealgebra and beginning algebra scholars examining linear relationships. They consider the rising water level as a swimming pool is being filled. They do so by charting and...
Curated OER
Practice and Skills Test
Students practice think pair share to solve equations. In this algebra lesson, students solve linear equations given a point and a slope. They solve equations given two points and no slope.
Curated OER
Orbiting Satellites
Eleventh graders explore the concept of orbits. In this Algebra II lesson, 11th graders investigate Earth-orbiting satellites as they use algebraic thinking to calculate altitude and velocity.
Curated OER
Real World Systems of Linear Equations
Students solve systems of equations with fluency. In this algebra lesson, students graph, use elimination and substitution to solve systems of equations. They identify the point of intersection using algebra.
Education Development Center
Geography of the Number Line
It's more than just numbers on a line, its an organizational, mental math machine to help learners understand the value of numbers. The tool is handy when introducing positive and negative integers to see their values and relationships....
Curated OER
Number Problems
Young scholars write equations for problems. In this number lesson, students add, subtract, multiply and divide numbers to solve for a variable. They rewrite word problems using algebraic symbols.
Illustrative Mathematics
Do Two Points Always Determine a Linear Function?
Your learners can approach this task algebraically, geometrically, or both. They analyze the building of a linear function given two points and expand the concrete approach to the abstract when they are asked to find the general form of...
Curated OER
Introduction to the National Debt
Students relate the national debt to the economy. In this algebra lesson, students discuss what the national debt is, create a national budget based on priority and what the government should spend money on. They analyze their findings...
Curated OER
Bacteria Populations
Your young microbiologists will interpret and solve exponential equations in this real-world context task set in a hospital research scenario. Learners think in terms of the functions as well as their rates of change.
EngageNY
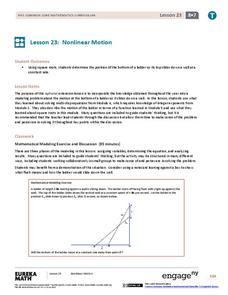
Nonlinear Motion
Investigate nonlinear motion through an analysis using the Pythagorean Theorem. Pupils combine their algebraic and geometric skills in the 24th lesson of this 25-part module. Using the Pythagorean Theorem, scholars collect data on the...
Illustrative Mathematics
Ice Cream
Algebra learners can always relate to ice cream. In this case, a carton of ice cream has been at room temperature for t minutes. Given an expression for the temperature of the ice cream, it is up to your number crunchers to rearrange the...
Illustrative Mathematics
Telling a Story With Graphs
Turn your algebra learners into meteorologists. High schoolers are given three graphs that contain information about the weather in Santa Rosa, California during the month of February, 2012. Graph one shows temperatures, graph two...
EngageNY
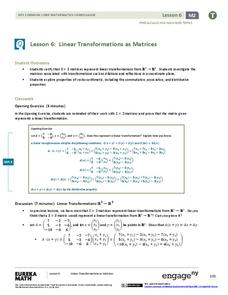
Linear Transformations as Matrices
Don't stop with two-dimensional learning, go to the next dimension! Learners verify that 3x3 matrices represent linear transformations in the third dimension. Additionally, they verify the algebraic properties that extend to vector...
Curated OER
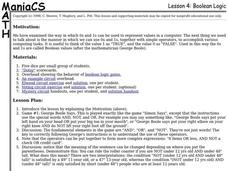
Boolean Algebra
Learners play a series of games involving Boolean logic. In this Boolean Algebra activity, students participate in games such as "George Boole Says" to explore Boolean logic. The format of the activity is difficult to read.
EngageNY
Solving Equations
Teach solving equations through an exploration of properties. Before pupils solve equations they manipulate them to produce equivalent equations. The activity switches the focus from finding a solution to applying properties correctly.
EngageNY
Margin of Error When Estimating a Population Mean (part 1)
We know that sample data varies — it's time to quantify that variability! After calculating a sample mean, pupils calculate the margin of error. They repeat the process with a greater number of sample means and compare the results.
EngageNY
Distributions—Center, Shape, and Spread
Data starts to tell a story when it takes shape. Learners describe skewed and symmetric data. They then use the graphs to estimate mean and standard deviation.
EngageNY
Dividing by (x – a) and (x + a)
Patterns in math emerge from seemingly random places. Learners explore the patterns for factoring the sum and differences of perfect roots. Analyzing these patterns helps young mathematicians develop the polynomial identities.
EngageNY
The Height and Co-Height Functions of a Ferris Wheel
Show learners the power of mathematics as they model real-life designs. Pupils graph a periodic function by comparing the degree of rotation to the height of a ferris wheel.
EngageNY
Using a Curve to Model a Data Distribution
Show scholars the importance of recognizing a normal curve within a set of data. Learners analyze normal curves and calculate mean and standard deviation.
EngageNY
Sampling Variability in the Sample Proportion (part 2)
Increase your sample and increase your accuracy! Scholars complete an activity that compares sample size to variability in results. Learners realize that the greater the sample size, the smaller the range in the distribution of sample...
Other popular searches
- Patterns Algebraic Thinking
- Algebraic Reasoning Unit
- Patterns, Algebraic Thinking
- Tiles Algebraic Thinking
- Algebraic Thinking in Music
- Algebraic Thinking Graphing
- Basic Algebraic Reasoning
- Algebraic Thinking Textbooks
- Algebraic Thinking/pattern
- Algebraic Thinking Part 2
- Algebraic Reasoning Assessment


