Curated OER
Fractions, Decimals, and Percentages Got You Down? "Tri" This!
Students explore number sense by creating a math presentation in class. In this parts of a whole lesson, students define and discuss the relationship between fractions, decimals and percentages before completing a problem worksheet in...
Curated OER
Math in the Wetlands Field Trip
Get your class out in the environment for hands on math activities. In this wetlands lesson, learners transplant native plants, calculate how much soil is needed, and perform math activities based on this experience. They then make...
Balanced Assessment
Who's Left?
If you're not right-handed, are you wrong-handed? Young statisticians calculate the percentage of left-handed people using a given data set in the assessment task. They plot data on a scatter plot and consider how the line of best fit...
Curated OER
Discovering Math Concepts in Business Mathematics, Economics, and Finance
Explore the concept of money and research its origin. There are many concepts related to business math, thusly, there are many formulas used to make calculations around money. Exchange rates of money in different countries, interest,...
Curated OER
Coal Supply and Demand
A hands-on simulation perfect for an economics instructional activity, young learners investigate the availability of different sources of natural energy (coal, natural gas, oil, solar, and nuclear) and how this availability affects...
CK-12 Foundation
Stratified Random Sampling: An Extracurricular Study
Learning isn't a random process. A well-designed interactive lesson helps classes make key conclusions about stratified random sampling. They calculate group percentages and use those percentages to decide on sampling totals.
Radford University
How Is Your Gender Represented?
Does the media shape people's views on gender? Scholars use data on gender portrayal in magazines to explore the idea. They use a spreadsheet program to create bar graphs and perform a chi-square test. They also use provided data to...
West Contra Costa Unified School District
Interest and the Number “e”
Make a connection between different types of interest and how they are calculated! This algebra II lesson progresses from simple interest to compound interest to continually compounded interest. Formulas are developed rather than given,...
Illustrative Mathematics
Margie Buys Apples
One of the most common, everyday applications of math is dealing with money. This single problem calculating how much change Margie receives is more involved than it appears at first glance. An understanding of how fractions and decimals...
Curated OER
Rising Gas Prices – Compounding and Inflation
Financial literacy skills and exponential models are connected by the compound interest formula in this task centered on inflation calculations. Collaborative learners get experience collecting data from the given websites and exploring...
Curated OER
Real Math
Students explore careers that require math knowledge and solve real life math problems. As a class, they compare and contrast classroom math to real life math and explore the links between algebra, geometry and math skills used in...
Bowland
AstroZoo
Rescue animals in the zoo by applying math concepts. Groups of learners solve three missions involving oxygen, food, and climate control. Each group selects an animal from one of four bio-domes.
Curated OER
Money and Percentage
Fifth graders examine use of percentages in real world situations. They complete worksheet about using percentages after reviewing the concept. They look through newspapers to find examples of percentages used over the course of three...
EngageNY
Margin of Error When Estimating a Population Proportion (part 1)
Use the power of mathematics to find the number of red chips in a bag — it's a little like magic! The activity asks learners to collect data to determine the percentage of red chips in a bag. They calculate the margin of error and...
Illustrative Mathematics
Should We Send Out a Certificate?
Fred thinks his test score is high enough to earn him a certificate. Given the mean and standard deviation, use properties of normal distributions to calculate Fred's percentile ranking and see if he is right. Consider having your class...
Bowland
Explorers – Patrol Services
Far out — plan a trip to space! Aspiring mathematicians steer a space vehicle through an asteroid field, calculate currency exchanges to buy provisions, and determine placement of charges to blow up asteroids. Along the way, they learn...
Statistics Education Web
NFL Quarterback Salaries
Use statistics to decide if NFL quarterbacks earn their salaries! Learners study correlation coefficients after using technology to calculate regression equations. Through the data, they learn the meaning of correlation and correlation...
Yummy Math
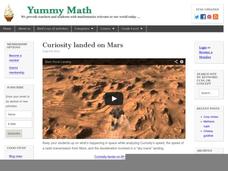
Curiosity Landed on Mars
Out of this world math and science are mixed together on a learning exercise that would be a great enrichment activity classrooms that are studying our solar system. The information presented is best suited toward middle school math, and...
Curated OER
Problem Solving Using Percentages
Students explore the concept of percentages. In this percentages lesson, students find the percentages of various colored m&m's in their bags. Students find the cost of items before and after a discount. Students use proportions to...
Curated OER
Pay Check Advance Loan
Students research loans. In this financial lesson, students explore the benefits and drawbacks of applying for a pay-day advance loan. Students compare different programs and calculate interest owed. Multiple resources are provided.
5280 Math
Interesting Times
Gain a little interest in functions with a real-life task. Young scholars analyze home loan data with a geometric sequence and series. They use the models to make predictions about the total loan payments at certain intervals in a...
Illustrative Mathematics
Do You Fit In This Car?
A short activity that focuses on the normal distribution as a model for data distribution. Using given means and standard deviations, your budding statisticians can use statistical tables, calculators, or other statistical software to...
Illustrative Mathematics
SAT Scores
If you earned a score of 610 on the math portion of the SAT, what would be your percentile ranking? Given the mean and standard deviation of normally distributed data, find the probability of getting a particular score, or that your...
Curated OER
Making Blood!
students research blood's components, and use their math skills to recreate a model of whole blood using commonly found food items.

